BRIEFING PAPERS
FOR ELECTED MEMBERS’
BRIEFING SESSION
Draft Only
to be held at
the Civic Centre,
Dundebar Road, Wanneroo
on 18 June, 2013 commencing at 6.00pm
BRIEFING PAPERS
FOR ELECTED MEMBERS’
BRIEFING SESSION
Draft Only
to be held at
the Civic Centre,
Dundebar Road, Wanneroo
on 18 June, 2013 commencing at 6.00pm

Briefing Papers for Tuesday 18 June, 2013
CONTENTS
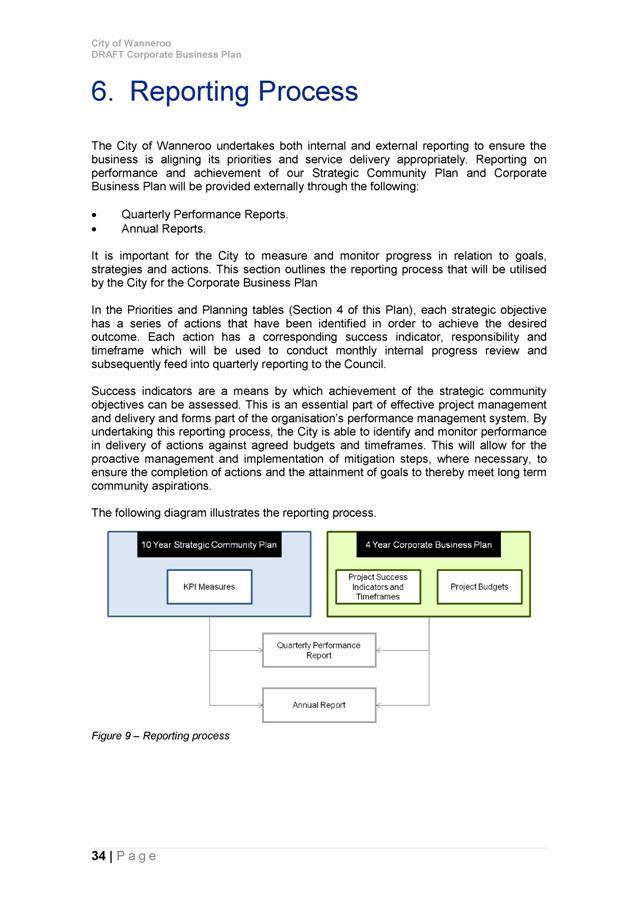
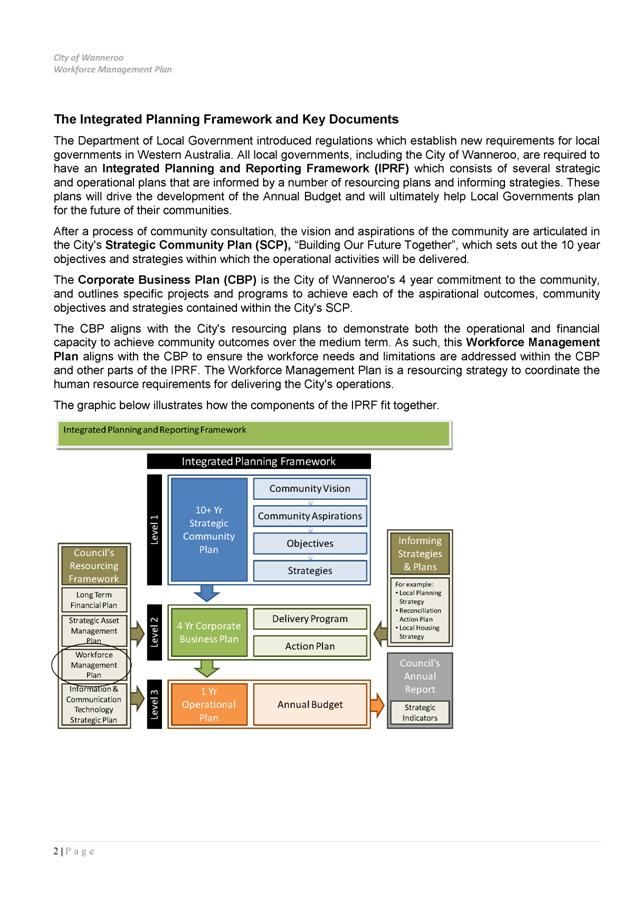
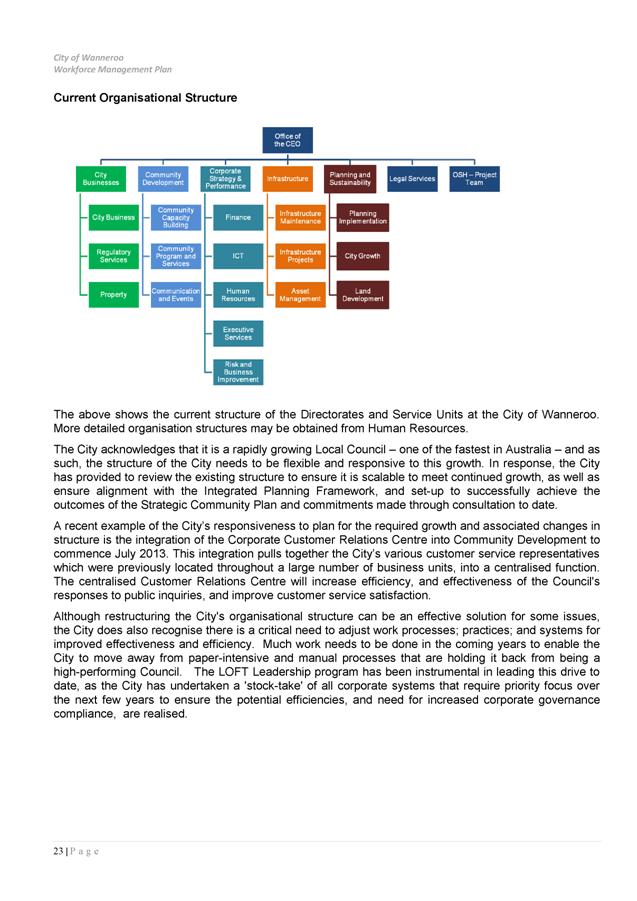
L.2 Integrated Planning & Reporting Framework
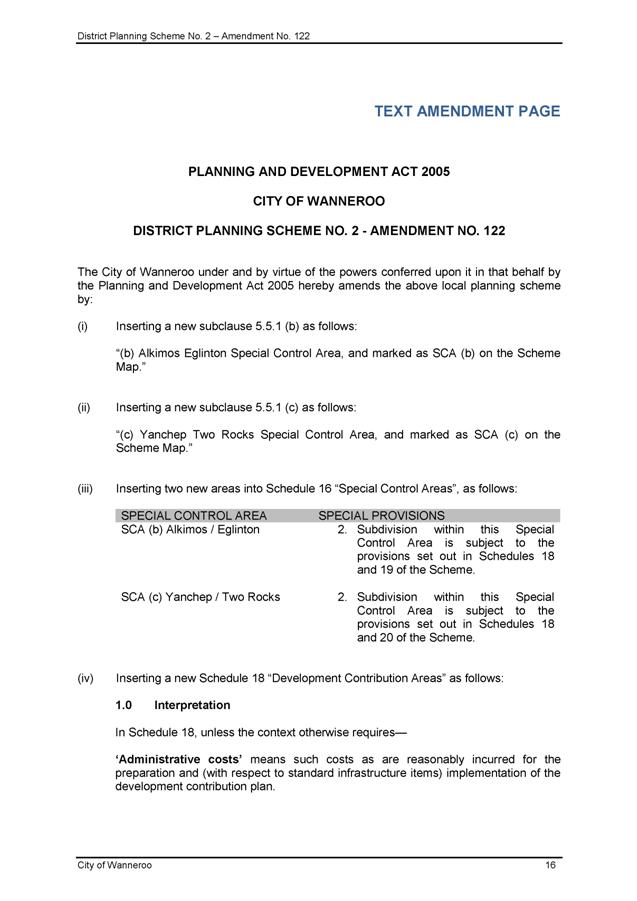
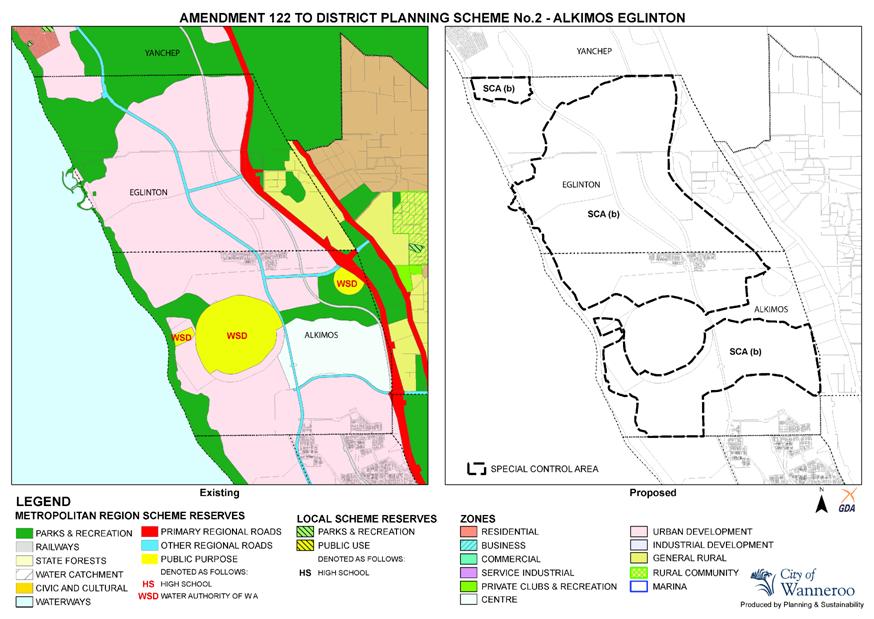
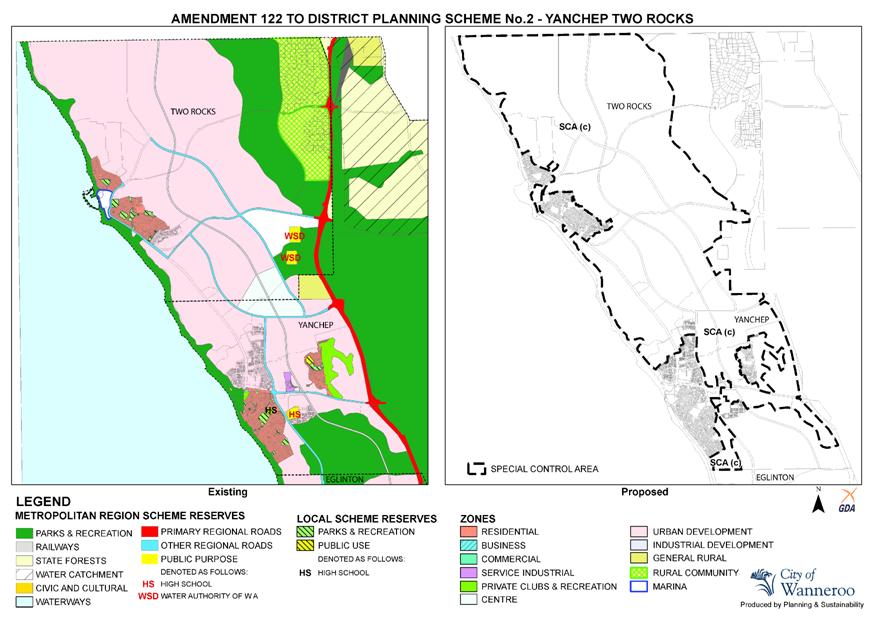
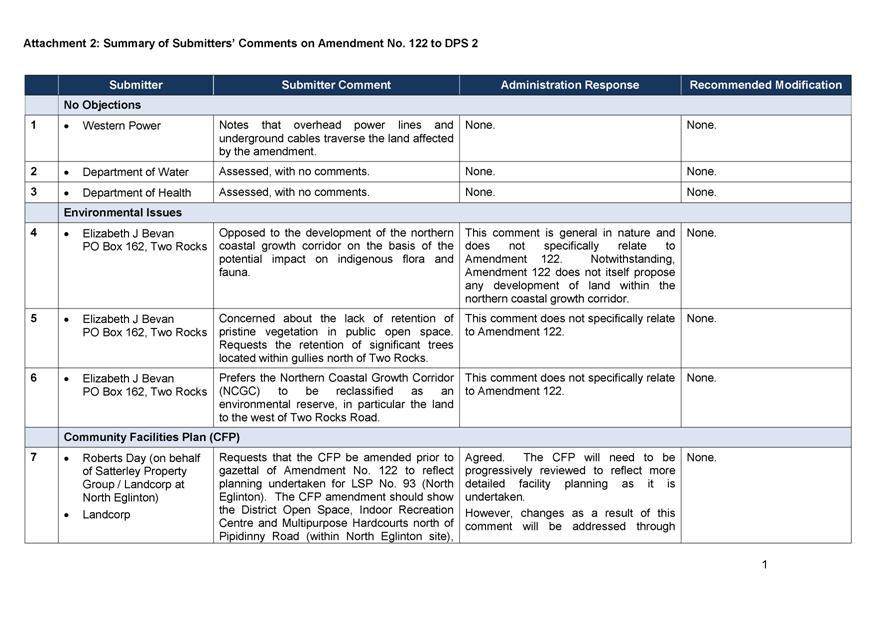
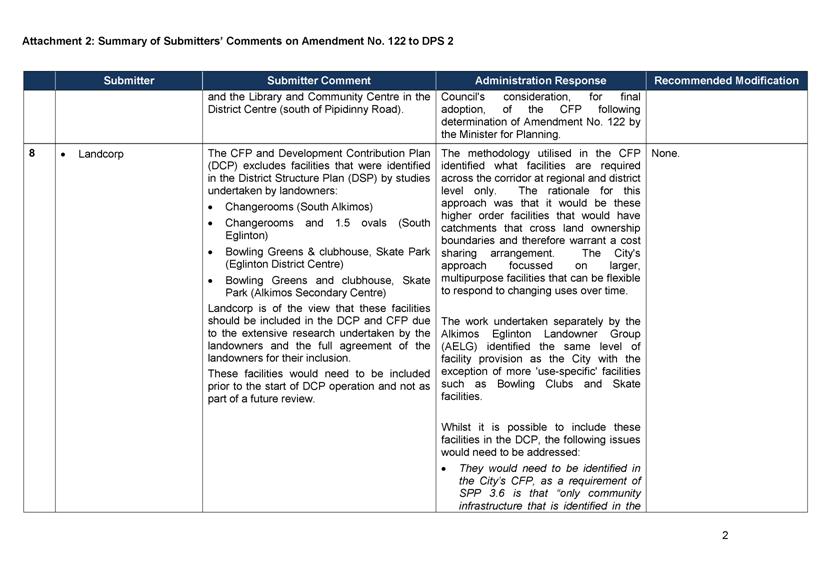
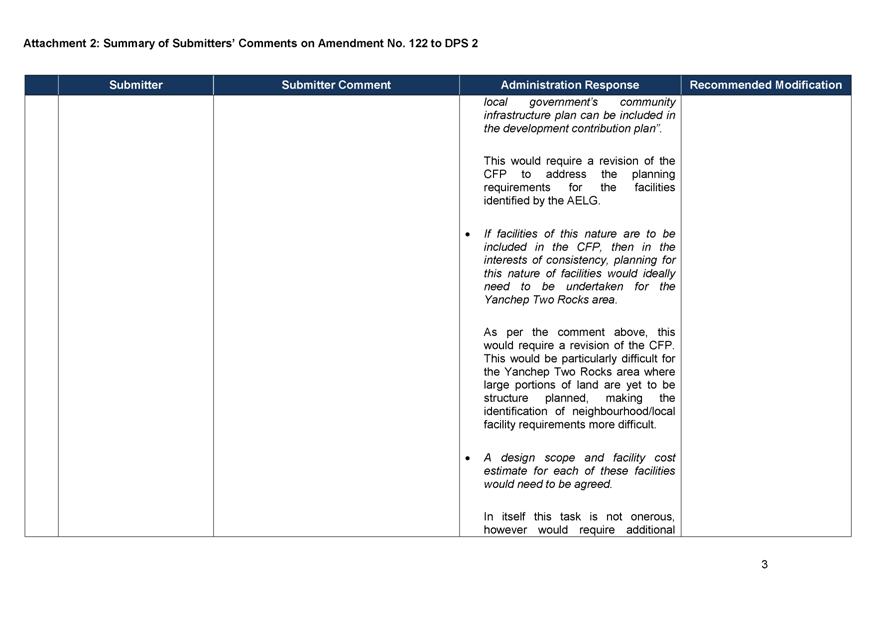
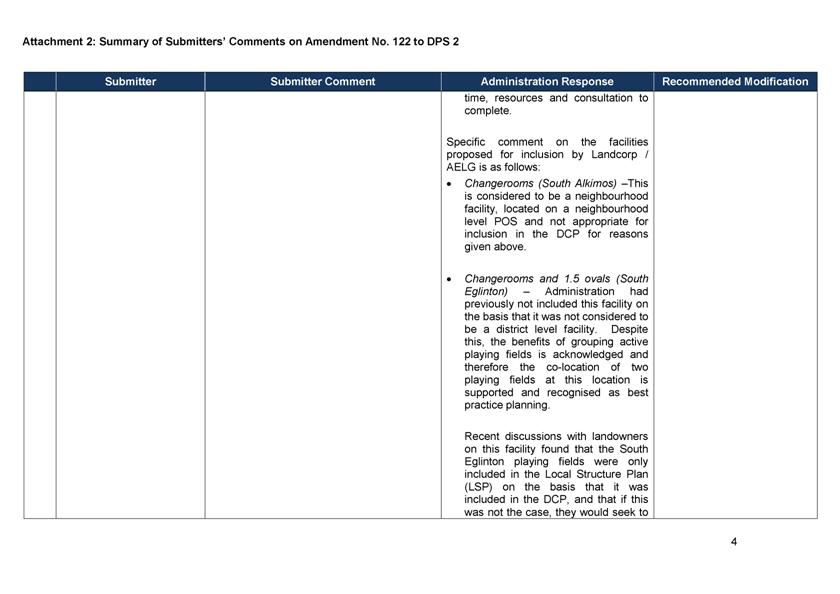
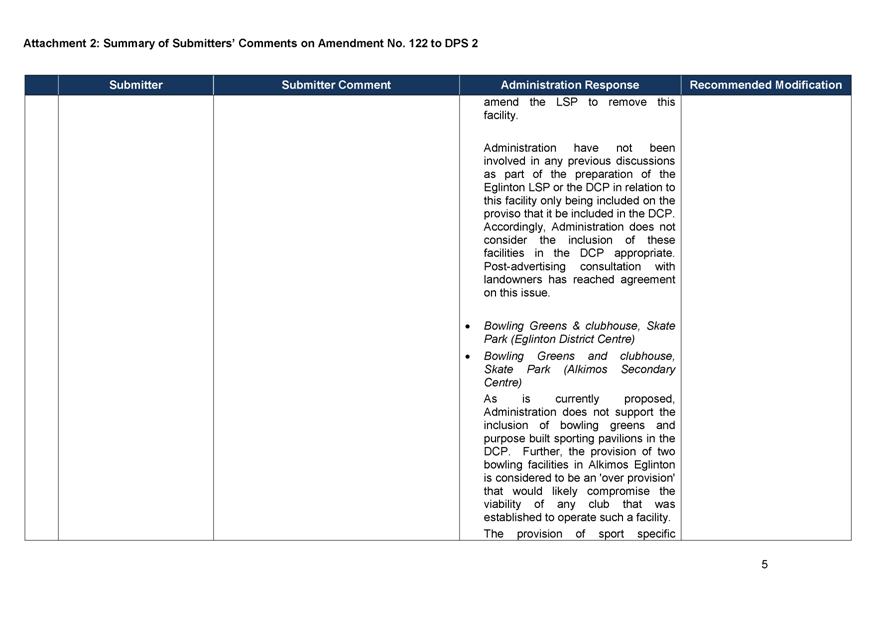
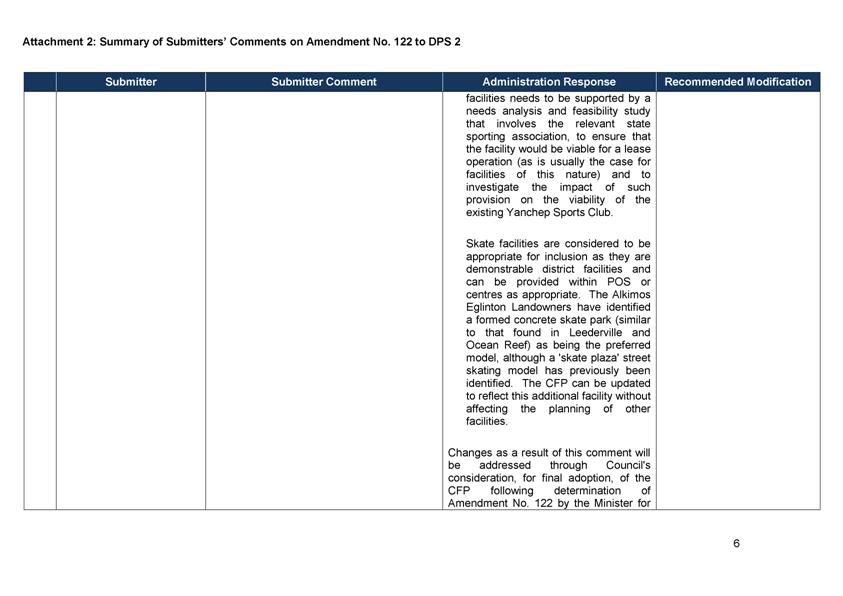
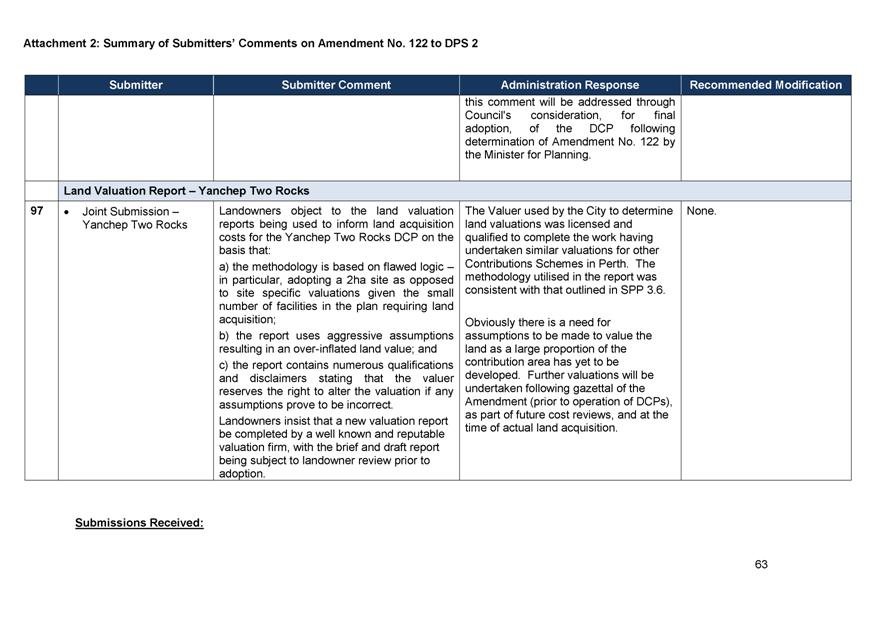
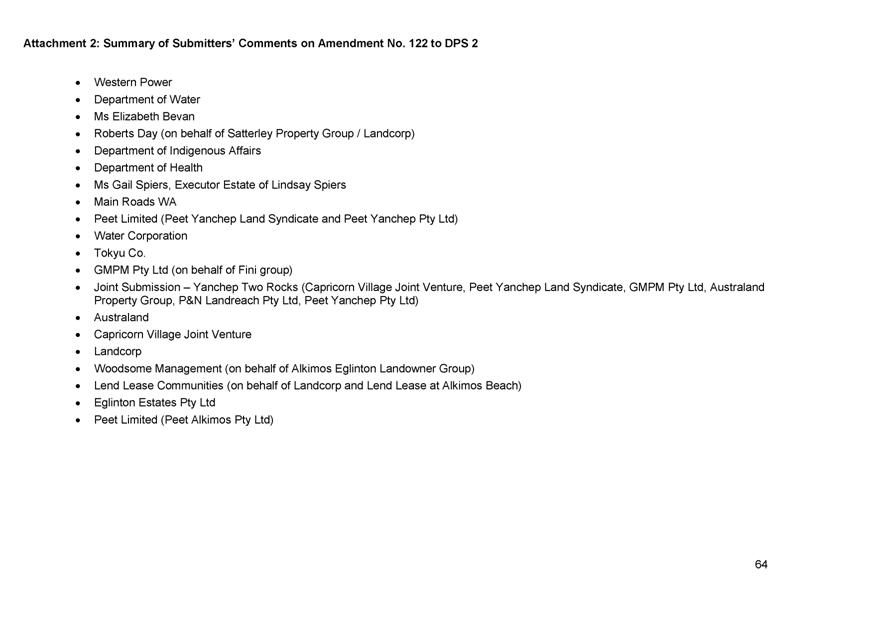
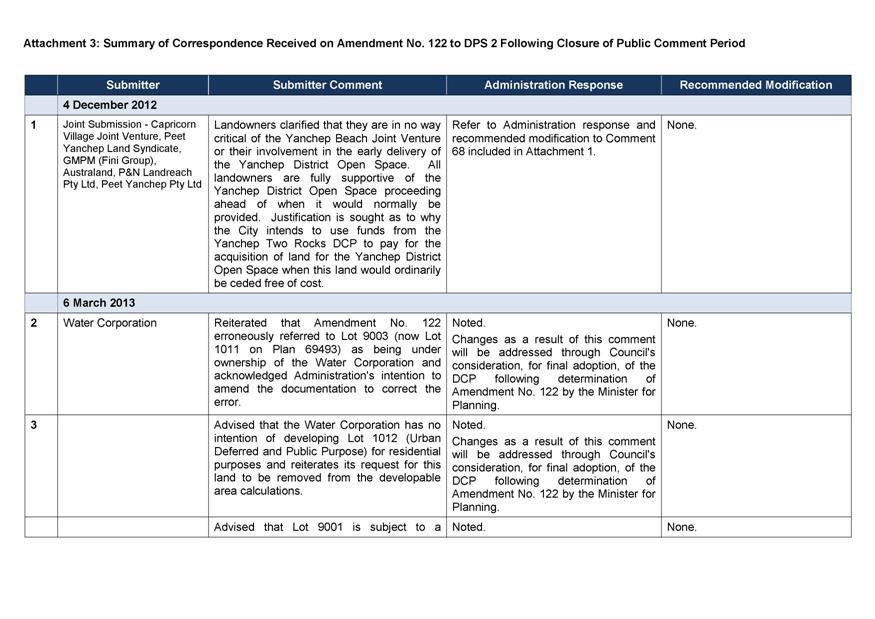
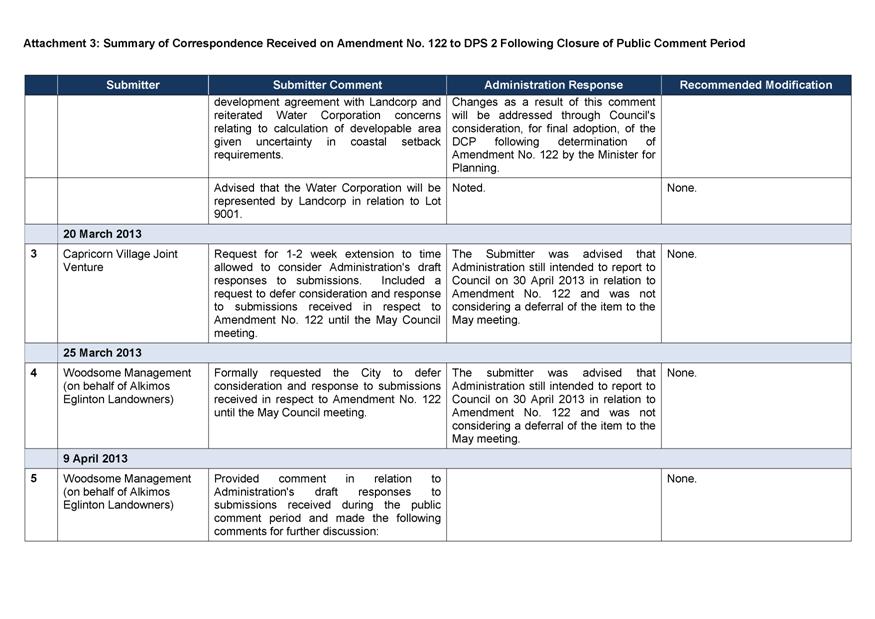
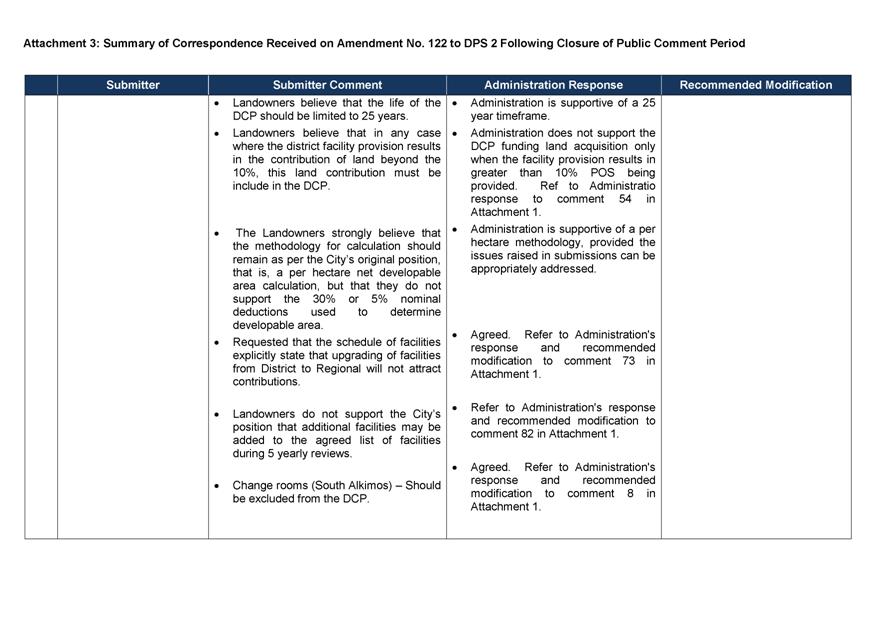
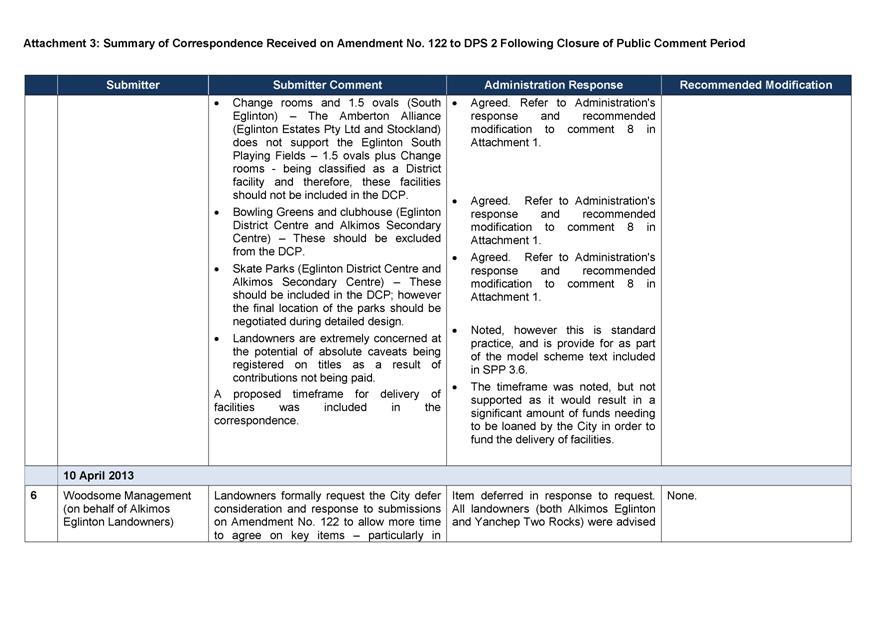
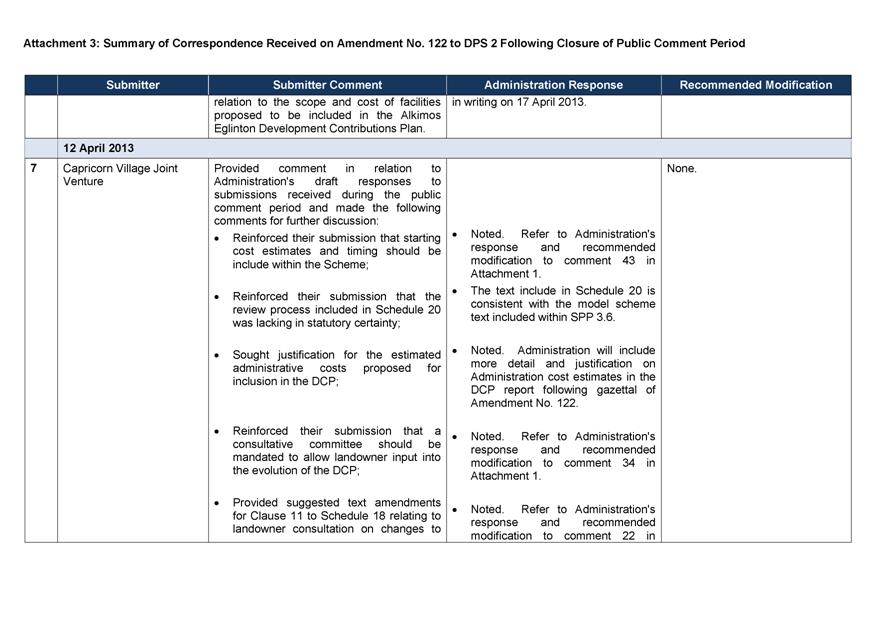
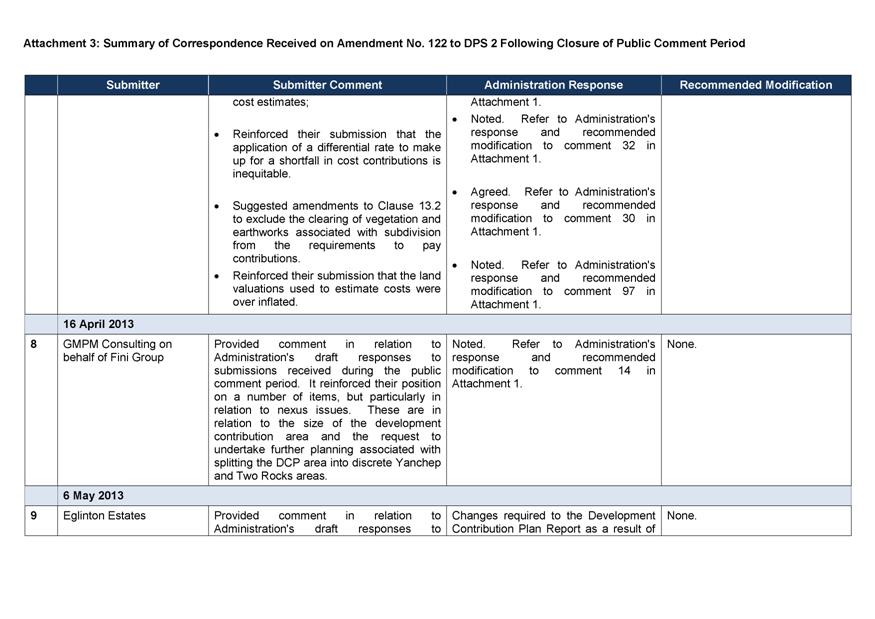
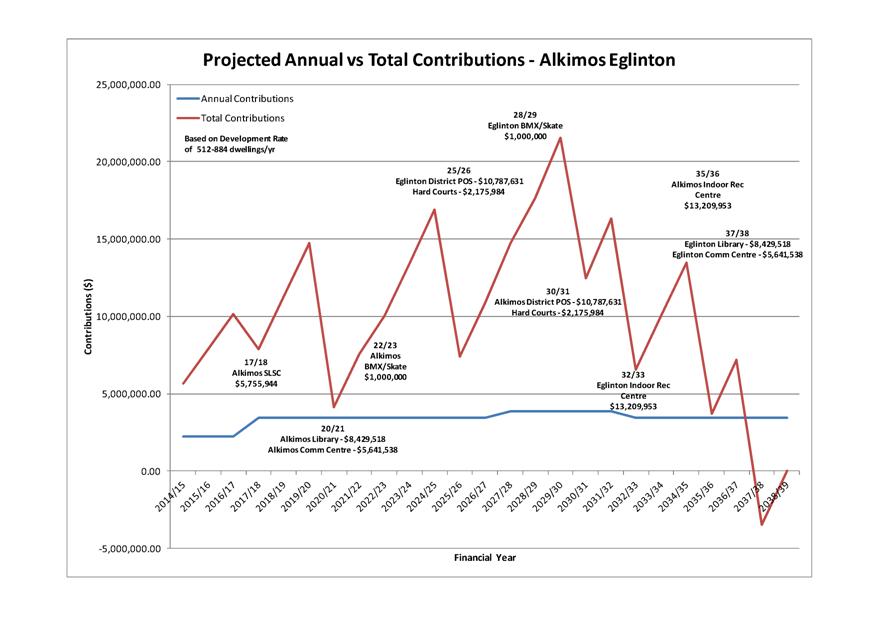
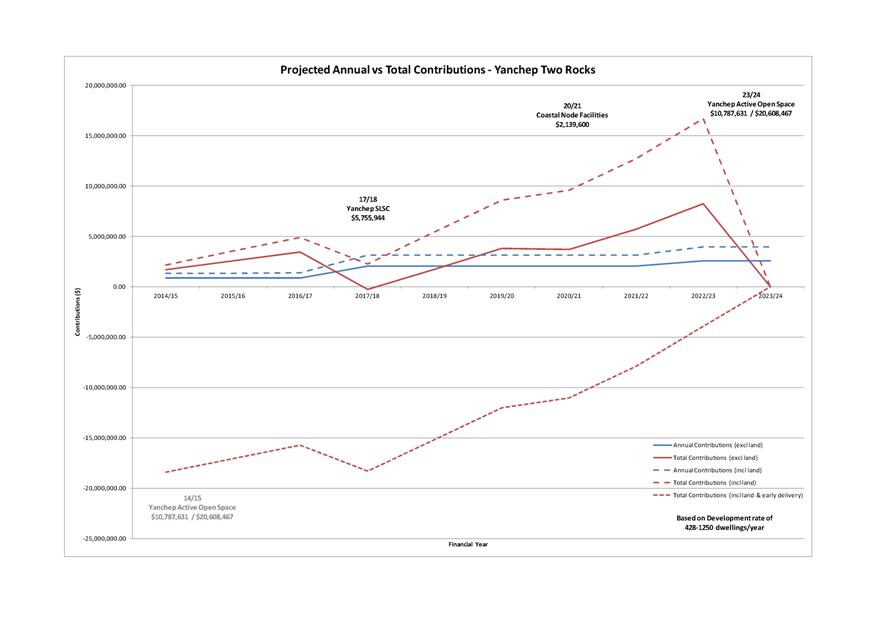
L.3 Amendment No. 122 to District Planning Scheme No. 2 - Northern Coastal Growth Corridor Development Contributions 462
Late Items Agenda
File Ref: 5509 – 13/59592
Responsible Officer: Director, Corporate Strategy and Performance
Disclosure of Interest: Nil
Attachments: 4
Issue
To consider adoption of the City’s Draft 2013/2014 Budget.
Background
In recent years, the Council had adopted a series of Budget Principles to apply prudent financial management practices in guiding the development of the Annual Budget and Long Term Financial Plan (previously referred to as Strategic Financial Management Plan). As the City has been currently undertaking extensive work with regard to the newly introduced Integrated Planning & Reporting Framework (IPRF) requirements, these Principles were maintained during the Budget development process. In addition, the following key economical parameters were recognised as part of the budget development:
- Forecast 2013/2014 CPI 2.5%
- Estimated growth in service requirement 4.0%
- Interest Rate on Investments 3.5%
In terms of working towards the adoption of the budget, a consistent approach to that of the previous year was taken, however as a separate report would also be presented to Council relating specifically to the IPRF, with the Long Term Financial Plan (LTFP) being a major component, this aspect will no longer be included as part of the Annual Budget report.
A series of Budget Workshops were arranged to involve and engage Elected Members as key stakeholders in the budget development process. The Workshops focused on discreet elements of the budget as outlined below:
· Budget Workshop 1 – Capital Works Program - Tuesday 12 March 2013
· Budget Workshop 2 – Operating Budget - Tuesday 9 April 2013
· Budget Workshop 3 – Preliminary Budget - Tuesday 14 May 2013
In considering the Budget, it is also timely to consider Regulation 34(5) of the Local Government (Financial Management) Regulations 1996, which requires a local government to adopt a percentage or value, calculated in accordance with Australian Accounting Standards, to be used in statements of financial activity for reporting material variances. For 2012/2013 the Council adopted 10% for the reporting of variances and the same percentage is proposed for 2013/2014.
Detail
In developing the 2013/2014 Budget, consideration has been given to the wider international economic context which remains quite uncertain and relatively weak in most leading countries like USA, China, India and most part of Europe. Australia’s domestic growth is expected to be quite modest and stable whilst inflation is anticipated to be in the range of 2-3% in the 2013/2014 financial year supported by the record low interest rate environment (cash rate is currently 2.75%).
At a local level for the City, this is being reflected as lower investment income potential, slightly slower than anticipated growth, delivering lower revenue growth and an unpredictable climate moving forward. Accordingly, a cautious approach has been taken in forecasting Revenues and activity levels for Wanneroo.
In conjunction with the Annual Budget development, Administration has continuously monitored the City’s financial performance for 2012/2013 to determine end of year forecasts and funding capacity for 2013/2014. This process has identified that the current 2012/2013 end of year Actual (Estimate) position will be an operational improvement of $6.172 million over that proposed in the original Adopted Budget, with the major contributor to this better than expected result being a 50% advance payment of 2013/2014 Financial Assistance Grants at approximately $3.006 million. This forecast result leaves the City in a stronger financial opening position for 2013/2014; however, a corresponding reduction of the early grant payment is reflected in the Operating Grants budget for 2013/2014 (neutral impact over two years).
The following documents provide a comprehensive outline of the proposed 2013/2014 Budget:
· 2013/2014 Annual Budget Overview (Attachment 1)
· 2013/2014 Statutory Budget (Attachment 2)
· 2013/2014 Capital Works Program (including carry forwards) (Attachment 3)
· 2013/2014 Schedule of Fees and Charges (Attachment 4)
The City of Wanneroo Budget has experienced continuous growth and this is primarily due to the following two factors:
1. Growth in the population and service area (expansion of service);
2. Community expectation and needs; and
3. Cost factor movements, such as Consumer Price Index (CPI), inflation or labour cost movements (increase to cost of service).
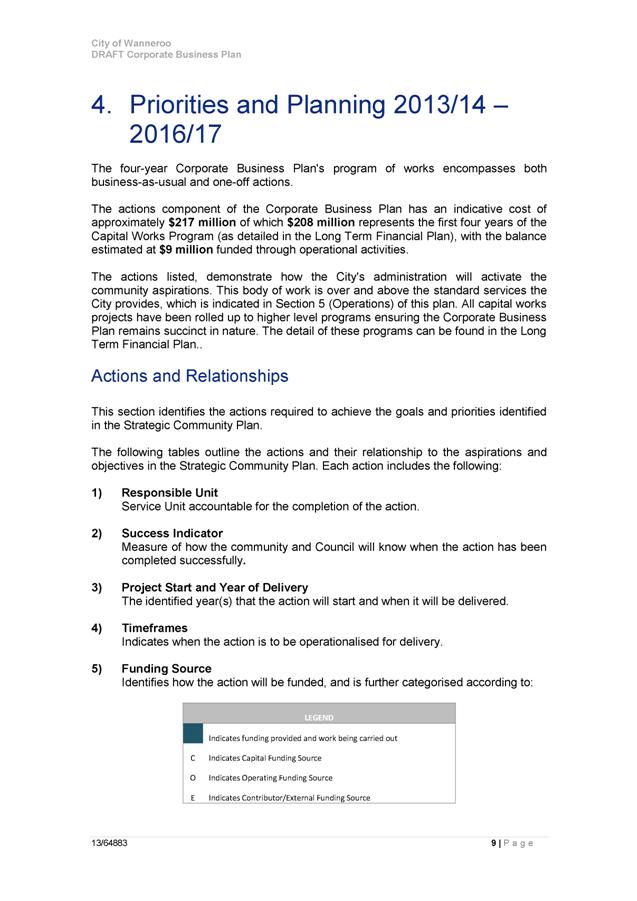
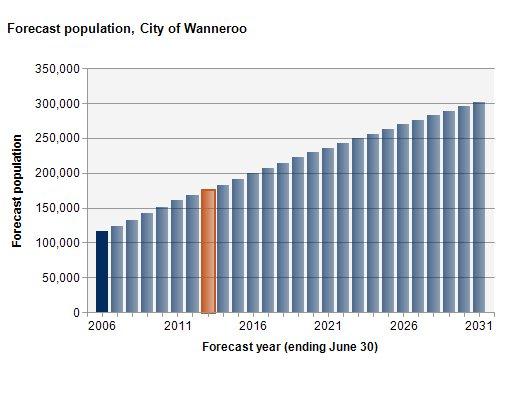
The City's population forecast estimates a population at 30 June 2013 of 175,081, up from 167,647 the previous year (7,434 or 4.43%).
The population growth in 2012/13 has been slightly lower than the above projection, with the following table reflecting growth statistics to end May and a projection to end June:
|
|
Actual 1/07/12 |
Actual 31/05/13 |
Forecast 30/0613 |
% Incr. |
|
New Lots Created |
68,250 |
2,742 |
2,991 |
4.4% |
|
Residential Development completed |
58,622 |
1,974 |
2,153 |
3.7% |
|
Population Increase |
167,647 |
5,646 |
6,200 |
3.7% |
The 2012/13 Budget was developed on the basis of a 4% growth factor, with an improvement to 5% being factored into 2013/14 in the Long Term Financial Plan. In terms of rate revenue, the 4% growth has been achieved in 2012/13, however on current trend, 4% has been maintained for 2013/14.
The development of the 2013/2014 Operating Budget recognises a steady improvement in the City's financial position and an opportunity to continue building on the essential services our residents rely on, with the health and wellbeing of the Wanneroo community continuing to be supported through the Community Development Budget, whilst priorities have been placed on the community safety initiatives, maintenance and upgrade of existing assets as well as provision for the development of new community buildings and sporting facilities in various locations.
Operating Budget Overview
Attachment 2 provides the detailed Annual Budget, with the Statement of Comprehensive Income (Nature and Type) reflecting the following totals in respect to the Operating position.
|
|
2012/2013 Adopted Budget $ Million |
2013/2014 Budget $ Million |
Increase $ Million |
Increase % |
|
Operating Income |
138.286 |
149.805 |
11.519 |
8.3 |
|
Operating Expenditure |
140.595 |
151.383 |
10.788 |
7.7 |
Comments relating to increases in the Operating Expenditure are:
· Employee Costs $4.449 million (+7.4%)
Reflects increase in the establishment through the endorsed Workforce Plan, together with standard annual increments to pay rates endorsed in the various Collective agreements.
· Materials and Contracts $3.192 million (+7.8%)
Reflect CPI adjustments and ongoing expansion in asset maintenance costs and responsibilities.
· Utility Charges $0.512 million (+6.9%)
Forecasted increase in Electricity, Gas and Water charges, together with growth factor for new assets and expansion of street lightning network.
· Depreciation on Non-Current Assets $2.629 million (+9.7%)
Increase in Depreciation associated with the City’s continuously expanding asset base. This increase when compared to 2012/2013 Revised Budget reduces to 4.8% ($1.287 million) in recognition of adjustments during the current financial year.
Administration Overhead Costs
During Budget Workshop 3, Elected Members requested Administration to provide benchmark details (ratios/graphs) on the administrative overhead costs of the City compared to total cost as part of the budget adoption material. Administration has researched and compiled the information below based on the 2009/10 to 2011/12 actual financials comparing to Cities of Perth, Joondalup, Swan and Stirling together with the ratio for the City for Budget 2013/14.
Selected Councils Annual Ratio Comparison for 2009/2010 to 2011/2012
It should be noted that based on the Local Government Accounting Manual issued by the Department of Local Government, all local governments' administrative overhead costs are described as Governance costs which include administration and operation of facilities and services to members of council and all costs that related to the tasks of assisting Elected Members and ratepayers on matters which do not concern specific council services or programs. As reflected by the ratios comparison, the City continuously maintains a very low administrative overhead ratio from 2009/10 to Budget 2013/14, at the range of 3.68% to 4.70%.
Fees and Charges
The Schedule of Fees and Charges for 2013/2014 is included as Attachment 4 for adoption by Council and to be effective from early in the new financial year (28 July or as soon as practicable). Details of all changes from those in 2012/2013 have been highlighted in the schedule.
Rate and Rubbish Charges
In developing the Rating strategy, Administration has endeavoured to retain equity and fairness in the process, by ensuring that the setting of the Minimum Rate and calculation of the Rate-in-the-Dollar only recovers an amount (referred to as the Budget Deficiency), which is considered essential to the running of Council activities as reflected in the long term financial plan.
Based on the level of Budget Deficiency, the Rate increase has been calculated on an average 5.5% increase. As per previous years the Domestic Refuse Collection service will form part of the normal activities of Council and be included as part of the General Rates, which ensures that the full benefit can be obtained from the State Government’s Pensioner Rate Rebate Scheme.
It should be noted that properties rated on an Unimproved Value (UV) basis are revalued annually, whereas Gross Rental Values (GRV) are revalued every three years (next review for 2014/2015). Where a revaluation has a significant impact on the category, an adjustment can be made to the Rate-in-the-Dollar to minimise the revaluation impact. This has not been necessary for the 2013/2014 Budget period.
In accordance with the requirements of Section 6.36(1) of the Local Government Act 1995, a notice was published on 21 May 2013 detailing proposed Differential and Minimum Rates for 2013/2014.
Due to a requirement to ensure no more than 50% of rates in any one category are minimum rated, on further modelling, it has been necessary to reduce the proposed Minimum Rate for GRV Residential Vacant. The following table demonstrates a comparison between the 2012/2013 Rates and the proposed Rates for 2013/2014. The City’s detailed Rate Setting Strategy is included in Attachment 2 - Annual Budget Overview.
|
Rate in the Dollar (cents) |
Minimum Rate $ |
||
|
GRV Category |
2012/2013 |
2013/2014 |
2012/2013 |
2013/2014 |
|
Caravan Parks & Park Homes Improved |
7.3520 |
7.7564 |
344 |
362 |
|
Commercial Improved |
7.1227 |
7.5144 |
1,076 |
1,135 |
|
Community Groups – Major Improved** |
7.8778 |
8.3111 |
228 |
240 |
|
Community Groups – General Improved |
3.7222 |
3.9269 |
228 |
240 |
|
Community Groups – Surf Club Improved |
1.9436 |
2.0505 |
228 |
240 |
|
Industrial Improved |
5.9959 |
6.3257 |
1,076 |
1,135 |
|
Industrial Improved – Storage Unit Lesser Minimum |
n/a |
n/a |
538 |
567 |
|
Residential Improved |
7.3530 |
7.7574 |
1,095 |
1,155 |
|
Rural and Mining Improved |
8.0397 |
8.4819 |
1,086 |
1,145 |
|
Commercial Vacant |
6.0865 |
6.4213 |
1,076 |
1,135 |
|
Industrial Vacant |
3.9192 |
4.1348 |
1,076 |
1,135 |
|
Residential Vacant |
10.2772 |
10.8424 |
665 |
668 |
|
Rural and Mining Vacant |
7.5130 |
7.9262 |
730 |
770 |
|
Rate in the Dollar (cents) |
Minimum Rate $ |
||
|
UV Category |
2012/2013 |
2013/2014 |
2012/2013 |
2013/2014 |
|
Commercial Improved |
0.2465 |
0.2597 |
1,076 |
1,135 |
|
Community Groups – Major Improved** |
0.2417 |
0.2550 |
228 |
240 |
|
Community Groups – General Improved |
0.1172 |
0.1237 |
228 |
240 |
|
Industrial Improved |
0.2304 |
0.2420 |
1,076 |
1,135 |
|
Residential Improved |
0.3135 |
0.3304 |
1,095 |
1,155 |
|
Rural and Mining Improved |
0.3130 |
0.3211 |
1,086 |
1,145 |
|
Commercial Vacant |
0.2613 |
0.2757 |
1,076 |
1,135 |
|
Industrial Vacant |
0.2577 |
0.2719 |
1,076 |
1,135 |
|
Residential Vacant |
0.3618 |
0.4296 |
665 |
701 |
|
Rural and Mining Vacant |
0.3280 |
0.3410 |
730 |
770 |
** = Sporting Clubs and Major Event Providers.
The City will also be responsible for collecting the Emergency Services Levy (ESL) on behalf of the Fire and Emergency Services Authority (FESA), which is determined each year by the Minister and is classified into five categories to reflect the level of emergency service response that is available in different areas. The City of Wanneroo levies the ESL for four of the categories in conjunction with the annual Rates charges.
The City also administrates the rebate to pensioners and seniors under the Rates and Charges (Rebates and Deferments) Act 1992 which are funded by the State Government.
For 2012/2013 Council approved the waiver of Council Rates (excluding the Emergency Services Levy) for land occupied by City of Wanneroo community groups. The same waiver is proposed for 2013/2014 for the groups listed below with the value of Rates revenues to be waived approximately $0.050 million:
|
- AJS Motorcycle Club of WA Inc |
|
- Kingsway Football & Sporting Club Inc |
|
- Kingsway Olympic Sports Club |
|
- Quinns Mindarie Surf Lifesaving Club Inc |
|
- Quinns Rocks Sports Club |
|
- Tiger Kart Club Inc |
|
- Wanneroo Agricultural Society |
|
- Wanneroo Amateur Football Club Inc, Wanneroo Cricket Club, Wanneroo Junior Cricket Club Inc & Wanneroo Junior Football Club (Wanneroo Showgrounds Clubrooms) |
|
- Wanneroo BMX Club |
|
- Wanneroo City Soccer Club Inc |
|
- Wanneroo Districts Cricket Club Inc (indoor facility) |
|
- Wanneroo Districts Cricket Club Inc & Wanneroo Districts Hockey Association Inc |
|
- Wanneroo Districts Netball Association |
|
- Wanneroo Districts Rugby Union Football Club Inc |
|
- Wanneroo Horse & Pony Club |
|
- Wanneroo Junior Motocross Club Inc |
|
- Wanneroo Racing Pigeon Club |
|
- Wanneroo Shooting Complex Inc |
|
- Wanneroo Sports & Social Club |
|
- Wanneroo Tennis |
|
- Wanneroo Trotting & Training Club Inc |
|
- Yanchep Golf Club |
|
- Yanchep Sports Club Inc |
|
- Yanchep Surf Lifesaving Club Inc |
The City commenced a review of its Rating Strategy during 2012/13. This review will continue in 2013/14, taking into account outcomes from the Integrated Planning process, impacting on the LTFP. It is proposed this will be workshopped with Council during 2013/14 and available for consideration for the 2014/15 Rating period and beyond.
Capital Works
The 10 Year Capital Works Program (incorporated into the LTFP) has been closely reviewed, balancing the demands for new infrastructure with the need to maintain and upgrade existing assets. Asset management plans have been developed for the different asset classes as an integral part of the Integrated Planning Framework to assist with the programming of maintenance, upgrade and replacement for existing assets.
The 2013/2014 Budget provides a total of $42.158 million Capital Works Program, excluding $30.152 million carry forward capital projects from 2012/2013 (Attachment 3). Some major new construction projects addressing the growth in the City include:
· Commencement of a major expansion ($27m) of the Civic Centre building - $1.635 million,
· Remediation and subdivision works of $1.600 million on Wangara industrial area,
· In excess on $0.670 million expanding our network of footpaths in the City,
· $2.300 million on the realignment of Brazier Road in Yanchep,
· A further $1.500 million on the upgrade of Lenore Road in Wanneroo,
· $2.900 million towards the construction of new district sporting facilities in the Yanchep/Two Rocks area.
Reserves
In order to meet the funding requirements of the Budget, a range of Reserve transfers are proposed from particular Reserves established for the relevant purpose. This includes transfers from the following Reserves:
· Asset Replacement
· Butler Collaborative Infrastructure Agreement
· City of Wanneroo Townsite
· Commercial Refuse - Plant Replacement
· Domestic Refuse
· Domestic Refuse - Plant Replacement
· Environmental Initiatives
· Golf Course
· Heavy Vehicle Replacement
· Light Vehicle Replacement
· Materials Facility Upgrade
· Neerabup Development
· Plant Replacement
· Quinns Caravan Park
· Strategic Projects/Initiatives
Through prudent budgeting in accordance with the previously adopted Budget Principles and the current Long Term Financial Plan, it has been possible to improve the City’s reserve funding capacity, which should enhance the City’s ability to meet future demands, without requirements on further loan funding.
Furthermore, to provide greater clarity and appropriate recognition of specific funding needs from reserves the establishment of an additional reserve and deletion of other reserves are proposed as follows:
Addition:
· Asset Renewal Reserve: To be used for the purpose of setting aside necessary funds for the future requirements of asset renewal and replenishments.
Deletion:
· Commercial Refuse Plant Reserve,
· Domestic Refuse Plant Replacement Reserve,
· Heavy Vehicle Replacement Reserve,
· Light Vehicle Replacement Reserve,
It is proposed that the above 4 reserves are to be abolished to rationalise the number of reserves, particularly that service similar requirements.
Funds equal to the carried forward replacement programs are to be transferred to the Plant Replacement Reserve with the balance being transferred to the Strategic Projects/Initiative Reserve.
· Asset Preservation Reserve,
· Fleming Park Lake Reserve.
It is proposed that the above 2 reserves are to be abolished due to the immaterial amount involved and the balance of the funds, if any, transferred to the Municipal Account to support the on-going expenses requirements.
Loan Funding
In 2006, the City secured a $60.778 million loan from Treasury Corp, to be drawn down over five years to assist in funding major and strategic projects with the final drawdown of $14.060 million having taken place in November 2010. Repayments are interest only, with the principal due for repayment in December 2026.
The application of the loans has been varied in successive Budgets to recognise changes in project costs, availability of alternative funding and changes in priorities and timing of projects. It is worth noting that the Loan Repayment Reserve is projected to have sufficient funds to fully repay the City’s $60.778 million loan back to State Treasury when it falls due (2026) through the previous annual transfers of $2.400 million to 2011/2012 together with forecast sale of land dividend income from Tamala Park Regional Council.
Key Changes to Budget since Workshop 3
The development of the Annual Budget is informed and updated continuously to reflect the latest factors likely to influence the City’s operations. As a result of a range of factors or clarification being obtained, the following adjustments have been made to the draft Budget since the previous Budget Workshop with Elected Members.
Operating Revenues -$2.692 million
Reduced to recognise that an early payment from the Grants Commission of 50% of the 2013/2014 Financial Assistance Grant will take place in 2012/2013.
Operating Expenses -$0.042 million
Reduced to recognise updated Depreciation calculations based on latest data to Budget 2013/2014.
Non Operating Revenue & Expenses +$1.977 million
Reduced to recognise recently signed contracts for the sale of the 2 EcoVision properties with 50% of the net proceeds to be recorded in 2012/2013 however also increased to reflect the funding of carry forward capital works.
New Capital +$0.900 million
To recognise an increase of $0.050 million to the furniture replacement program and a new inclusion of $0.850 million for an access road to Yanchep Playing Fields.
Carry Forward Capital +$30.152 million
To recognise the forecast value of Capital Projects which are likely to remain unspent as at the end of the current financial year, to be finished in 2013/2014. Major projects to be carried forward include:
PR-1671 Yanchep Lagoon Redevelopment $0.850m
Kingsway Regional Sporting Complex $3.602m
Flynn Drive, Neerabup – Construct Road $6.341m
Lenore Road, Wanneroo – Construct Carriageway $6.120m
Upgrade Roundabout Marmion/Hester Ave $0.900M
Upgrade road – McPharlin Ave $0.470M
Traffic treatments – Lagoon Dr/Brazier Ave $0.517M
Wanneroo Road Streetscape $0.927M
Wangara MRF Upgrade $0.498M
The carry forward projects are supported by the following funding sources:
- Grants and Contributions $5.382M
- TPS $9.310M
- Reserves $2.718M
- Loans $4.897M
- Municipal $7.845M
Consultation
In accordance with the requirements of Section 6.36 of the Local Government Act 1995, the City is required to give notice of its intention to levy Differential General Rates and Specified Minimum Payments. Notices to this effect were advertised on 21 May 2013, open for a submission period of 21 days. No submissions were received within the submission period.
Comment
In developing the 2013/2014 Budget, various non-controllable economic and legislative factors have been considered, including the uncertain and remaining weak international economic environment, Australia’s slowing national growth and low inflation, plus a full year better than anticipated impact of the new Building Act legislation and the flow on effects of the carbon tax. The compound effect of these factors together with the compliance requirements of the Integrated Planning Framework creates a significant degree of complexity to the preparation of the 2013/2014 Budget. Nonetheless, a prudent and responsible approach has been taken in forecasting revenues and activity levels for Wanneroo.
This approach results in an Operating budget that reflects an 8.3% increase in Operating Income and an increase in Operating Expenditure of 7.7% when comparing to the 2012/2013 Adopted Budget. Furthermore, the following factors and the associated risks and opportunities affecting the City’s Budget must be noted:
1. On the 7 June 2013, Commonwealth Government has paid the City in advance 50% of the 2013/2014 Financial Assistance Grants which equated to $3.006 million. This revenue will be receipted as income in 2012/2013. This factor alone can be directly attributed to the Operating deficit (-$1.578 million) being reflected for 2013/2014. Hence notionally reinstating the grants income to a full year scenario would provide a modest Operating Surplus.
2. The Reserve Bank recently cut the cash rate by another 0.25% at its May meeting with the current cash rate now reflecting as 2.75%. Economic commentaries suggest that further rate cuts may be possible by end of this year and if they eventuate, the situation will have some detrimental impact on the City's investment earnings.
3. Recent amendments to the Local Government (Financial Management) Regulations 1996, restrict investments effective from 1 July 2012 onwards to the following highly secured investments:
· Authorised deposit taking institutions and the Western Australian Treasury Corporation for a term not exceeding 12 months;
· Bonds that are guaranteed by the Commonwealth Government or a State or Territory for a term not exceeding three years; and
· Australian currency.
This regulation has materially restricted the flexibility of local government investment options to low yield high security financial instruments, however; that is consistent with the City's previous prudent approach.
4. A Review of Commercial Waste has been undertaken and the City will phase out a portion of the commercial business stream, in particular Bulk Bins, which operates in a highly competitive market.
5. The changes to the Building Act which came into effect 1 April 2012 have shown minimal adverse impacts to the City's building application approval activities and revenues in 2012/2013. However, the City will continue to closely monitor the development in this regard, especially the growth in private certification practices businesses. It is believed that the new legislation's impact will not be known until after another 12 months.
6. The Mindarie Regional Council (MRC) Gate Fee has been modelled on a scenario of $149 per tonne, increased from this year's fee of $137 per tonne (8.6% increase). The impact of the Gate Fee on Refuse Removal Expenses is significant given the City is the largest contributor to MRC by way of tonnages, which are estimated at approximately 78,000 tonnes, including the residue from the Wangara Recycling Centre.
The Budget provides a total of $42.158 million Capital Works Program (excluding $30.152 million Carry Forward Capital Projects from 2012/2013), which will deliver significant improvements to the local community. It balances the real need for services and infrastructure in the City’s North and Coastal growth corridors whilst recognising the need for new, renewal and upgrade of facilities and services in the City’s established areas.
In light of the recent economic uncertainty, this Budget is considered to be financially prudent and responsible, providing efficiencies, whilst maintaining a high level of service and delivering on long-term sustainability through initiatives such as the Debt Management Strategy and addressing Asset Renewal and Upgrade. Importantly, over the longer term, it establishes a process for building on the City’s Reserves.
The proposed level of rate increase of 5.5% is consistent with the principle established in the PWC report Western Australian Local Government Association Rate Setting Processes, Funding Amenity and Service Sustainability of WA Outer Metropolitan Growth Councils and actually 0.4% lower than that forecast in the previous LTFP. This is considered appropriate when taking into account the challenges imposed by the reduced growth in income and noting that the Rate includes the Rubbish Charge.
Statutory Compliance
The accompanying Budget for 2013/2014 has been prepared in accordance with the Local Government Act 1995 (the Act), Local Government (Financial Management) Regulations 1996 and Australian Accounting Standards.
Pursuant to Section 6.33(3) of the Act, Administration has written to the Minister seeking approval to the Differential General Rates as published. Confirmation of approval is required (and anticipated) prior to Budget Adoption, however at the time of writing this report is yet to be received.
Pursuant to Section 6.36(1) of the Act, the City has given the appropriate notice of its intention to impose Differential General Rates and Specified Minimum Payments in respect of each Differential Rate Category. No submissions were received by close of submission period.
In accordance with Section 6.36(5), the City may modify the proposed rates and minimum payments after considering any submissions, without the requirement for further local public notice. The only modification proposed is to reduce the Minimum Rate for Residential Vacant from $701 to $668 to comply with the legislative requirement for a maximum of 50% of properties in a category to be rated on a minimum rate basis.
Sub-regulation 56(4)(b) of the Local Government (Financial Management) Regulations 1996 requires that the Rate Notices provide details and reasons for any variation in the Minimum Rate and Differential Rate from that proposed in the notice published in accordance with Section 6.36 of the Act.
Strategic Implications
The proposal accords with the following Outcome Objective of the City’s Strategic Plan 2006 – 2021:
“4 Governance
4.6 Provide and maintain a high standard of governance and accountability”
Policy Implications
Nil
Financial Implications
The timely adoption of the 2013/2014 Annual Budget will facilitate opportunities in terms of investment revenue and allow the implementation of the Capital Program.
Voting Requirements
Absolute Majority
That Council by an ABSOLUTE MAJORITY: -
1. ADOPTS the Budget for the City of Wanneroo for the Financial Year Ending 30 June 2014, incorporating:
1.1 Statement of Comprehensive Income, showing Total Comprehensive Income of $43,106,715 Surplus.
1.2 Statement of Cash Flows, showing cash at end of year position of $145,069,608.
1.3 Rate Setting Statement, showing the need to generate $109,500,000 in Rates.
1.4 Notes To and Forming Part of the Budget.
1.5 Attachments (3) & (4) being –
(3) 2013/2014 Capital Works Program (including Carry Forwards from 2012/2013).
(4) 2013/2014 Schedule of Fees and Charges.
2. In accordance with Section 6.47 of the Local Government Act 1995, AGREES to waive the 2013/2014 Council rates (excludes Emergency Services Levy) for land leased by the City to the following community groups:
· AJS Motorcycle Club of WA Inc
· Kingsway Football & Sporting Club Inc
· Kingsway Olympic Sports Club
· Quinns Mindarie Surf Lifesaving Club Inc
· Quinns Rocks Sports Club
· Tiger Kart Club Inc
· Wanneroo Agricultural Society
· Wanneroo Amateur Football Club, Wanneroo Cricket Club, Wanneroo Junior Cricket Club and Wanneroo Junior Football Club (Wanneroo Showgrounds Clubrooms)
· Wanneroo BMX Club
· Wanneroo City Soccer Club Inc
· Wanneroo Districts Cricket Club Inc (indoor facility)
· Wanneroo Districts Cricket Club Inc & Wanneroo Districts Hockey Association Inc
· Wanneroo Districts Netball Association
· Wanneroo Districts Rugby Union Football Club Inc
· Wanneroo Horse & Pony Club
· Wanneroo Junior Motocross Club Inc
· Wanneroo Racing Pigeon Club
· Wanneroo Shooting Complex Inc
· Wanneroo Sports & Social Club
· Wanneroo Tennis
· Wanneroo Trotting & Training Club Inc
· Yanchep Golf Club
· Yanchep Sports Club Inc
· Yanchep Surf Lifesaving Club Inc
3. Differential Rating
In accordance with the provisions of Sections 6.32, 6.33 and 6.35 of the Local Government Act 1995:
3.1 IMPOSES Differential Rates and Minimum Rates for the 2013/2014 Financial Year; and
3.2 NOTES that the Differential Rates and Minimum Rates for the 2013/2014 Financial Year are inclusive of Domestic Rubbish Collection Charges where applicable, and
3.3 SETS the Differential General Rates in accordance with the following tables:
3.3.1 General Rate – Gross Rental Value & Minimum Rates
In accordance with the Minister’s approval received on xx June 2013 and subject to the provisions of Sections 6.32, 6.33 and 6.35 of the Local Government Act 1995, impose the 2013/2014 Gross Rental Value Differential Rates and Minimum Rates as follows: -
|
GRV Category |
Rate in Dollar (cents) |
General Minimum Rate $ |
|
Caravan Parks & Park Homes Improved |
7.7564 |
362 |
|
Commercial Improved |
7.5144 |
1135 |
|
Community Groups – Major Improved** |
8.3111 |
240 |
|
Community Groups – Surf Clubs Improved |
2.0505 |
240 |
|
Community Groups – General Improved |
3.9269 |
240 |
|
Industrial Improved |
6.3257 |
1135 |
|
Industrial Improved – Lesser Minimum |
N/A |
567 |
|
Residential Improved |
7.7574 |
1155 |
|
Rural and Mining Improved |
8.4819 |
1145 |
|
Commercial Vacant |
6.4213 |
1135 |
|
Industrial Vacant |
4.1348 |
1135 |
|
Residential Vacant |
10.8424 |
668 |
|
Rural and Mining Vacant |
7.9262 |
770 |
** = Sporting Clubs & Major Event Providers
3.3.2 General Rate – Unimproved Value & Minimum Rates
In accordance with the Minister’s approval received on xx June 2013 and subject to the provisions of Sections 6.32, 6.33 and 6.35 of the Local Government Act 1995, impose the 2013/2014 Unimproved Value Differential Rates and Minimum Rates as follows: -
|
UV Category |
Rate in Dollar (cents) |
General Minimum Rate $ |
|
Commercial Improved |
0.2597 |
1135 |
|
Community Groups – Major Improved** |
0.2550 |
240 |
|
Community Groups – General Improved |
0.1237 |
240 |
|
Industrial Improved |
0.2420 |
1135 |
|
Residential Improved |
0.3304 |
1155 |
|
Rural and Mining Improved |
0.3211 |
1145 |
|
Commercial Vacant |
0.2757 |
1135 |
|
Industrial Vacant |
0.2719 |
1135 |
|
Residential Vacant |
0.4296 |
701 |
|
Rural and Mining Vacant |
0.3410 |
770 |
** = Sporting Clubs & Major Event Providers
4. Domestic Refuse Charges
Pursuant to the provisions of Division 5 of Part IV of the Health Act (as amended) and Section 67 under Division 3, Part 6 of the Waste Avoidance and Resource Recovery Act 2007, impose the following Domestic Refuse Charges for the 2013/2014 Financial Year: -
4.1 Standard Service Charge p.a. (one 240L recycling bin & one 240L rubbish bin) included within General Rates.
4.2 Additional Service Charge p.a. (one 240L recycling bin & one 240L rubbish bin) $360.50.
4.2 Additional Recycling Service Charge Only p.a. (one 240L recycling bin) $160.00.
4.3 Additional Rubbish Service Charge Only p.a. (one 240L rubbish bin) $334.75.
4.4 Establishment Charge (per each new or additional service, one 240L recycling bin & one 240L rubbish bin) $98.90.
4.5 Establishment Charge (per each new or additional 240L recycling bin or additional 240L rubbish bin) $54.40.
5. Private Swimming Pool Inspection Fees
In accordance with the provisions of the Local Government (Miscellaneous Provisions) Act 1960, Section 245A, IMPOSES for the 2013/2014 financial year, a Private Swimming Pool Inspection Fee on construction of $39.60 (inclusive of GST) and in each subsequent year thereafter a Private Swimming Pool Inspection Fee of $18.20 (inclusive GST) for each property where there is located a private swimming pool.
6. Payment Incentives
In accordance with the provisions of Section 6.46 of the Local Government Act 1995, offer the following incentives for the payment of Rates and Charges: -
• Full payment
Full payment of all current and arrears of Rates and Charges and Private Swimming Pool Inspection Fees (inclusive of GST) within 35 days of the issue date on the Annual Rate Notice: -
- eligibility to enter the early incentive draw.
• Two Instalments
The first instalment of 50% of the total current Rates and Charges, Private Swimming Pool Inspection Fees (inclusive of GST) and Instalment Charge, plus the total outstanding arrears payable within thirty-five (35) days of date of issue of the Annual Rate Notice: -
- eligibility to enter the early incentive draw.
• Four Instalments
The first instalment of 25% of the total current Rates and Charges, Private Swimming Pool Inspection Fees (inclusive of GST) and Instalment Charge, plus the total outstanding arrears payable within thirty-five (35) days of date of issue of the Annual Rate Notice: -
- eligibility to enter the early incentive draw.
7. Payment Options
In accordance with the provisions of Section 6.45 of the Local Government Act 1995, offer the following payment options for the payment of Rates and Charges and Private Swimming Pool Inspection Fees (inclusive of GST): -
• One Instalment
Payment in full within 35 days of the issue date of the Annual Rate Notice.
· Two Instalments
The first instalment of 50% of the total current Rates and Charges, Private Swimming Pool Inspection Fees (inclusive of GST) and Instalment Charge, plus the total outstanding arrears payable within 35 days of date of issue of the Annual Rate Notice.
The second instalment of 50% of the total current Rates and Charges, Private Swimming Pool Inspection Fees (inclusive of GST) and Instalment Charge, payable 63 days after due date of first instalment.
· Four Instalments
The first instalment of 25% of the total current Rates and Charges, Private Swimming Pool Inspection Fees (inclusive of GST) and Instalment Charge, plus the total outstanding arrears payable within 35 days of date of issue of the Annual Rate Notice.
The second, third and fourth instalments each of 25% of the total current Rates and Charges, Private Swimming Pool Inspection Fees (inclusive of GST) and Instalment Charge, payable as follows: -
- Second Instalment 63 days after due date of first instalment.
- Third Instalment 63 days after due date of second instalment.
- Fourth Instalment 63 days after due date of third instalment.
8. Late Payment Interest
In accordance with the provisions of Sections 6.13 and 6.51 of the Local Government Act 1995, impose interest on all arrears and current charges in respect of Rates and Charges and Private Swimming Pool Inspection Fees (including GST where applicable) at a rate of 8.45% per annum, calculated on a simple interest basis on arrears amounts that remain unpaid and current amounts that remain unpaid after thirty-five (35) days from the issue date of the Original Rate Notice, or the due date of the instalment and continues until instalment is paid.
Excluded are Deferred Rates, Instalment current amounts not yet due under the Four (4) payment options, Registered Pensioner Portions and current Government Pensioner Rebate amounts.
Such interest is to be charged once per month on the outstanding balance on the day of calculation for the number of days, as previously detailed.
9. Instalment and Arrangements Administration Fees and Interest Charges
In accordance with the provisions of Section 6.45 of the Local Government Act 1995, for the 2013/2014 Financial Year, the following Administration Fees and Charges are imposed for payment of Rates and Charges and Private Swimming Pool Inspection Fees (inclusive of GST): -
Two Instalment Option
An Administration Fee of $5.00 for Instalment Two, together with an Interest Charge of 5.5% per annum, calculated on a simple interest basis on:
• 50% of the total current General Rate and Charges and Private Swimming Pool Inspection Fees (inclusive of GST) calculated 35 days from the date of issue of the Annual Rate Notice to 63 days after the due date of the first instalment.
Four Instalment Option
An Administration Fee of $5.00 for each of Instalment Two, Three and Four, together with an Interest Charge of 5.5% per annum, calculated on a simple interest basis on:-
• 75% of the total current General Rate and Charges and Private Swimming Pool Inspection Fees (inclusive of GST) calculated thirty-five (35) days from the date of issue of the Annual Rate Notice to 63 days after the due date of the first instalment;
• 50% of the total current General Rate and Charges and Private Swimming Pool Inspection Fees (inclusive of GST) calculated from the due date of the Second (2nd) Instalment to the due date of the Third (3rd) Instalment; and
• 25% of the total current General Rate and Charges and Private Swimming Pool Inspection Fees (inclusive of GST) calculated from the due date of the Third (3rd) Instalment to the due date of the Fourth (4th) Instalment.
10. ADOPTS the Significant Accounting Policies as detailed in Note 1 of Attachment 2 (2013/2014 Statutory Budget).
11. ADOPTS a percentage of 10% for the purposes of the reporting of material variances by Nature and Type monthly for the 2013/2014 Financial Year, in accordance with Regulation 34(5) of the Local Government (Financial Management) Regulations 1996.
12. As part of the Budget AUTHORISES the establishment of the following new Reserve:
· Asset Renewal.
13. As part of the Budget AUTHORISES the deletion of the following Reserves:
· Commercial Refuse Plant Replacement;
· Domestic Refuse Plant Replacement;
· Heavy Vehicle Replacement;
· Light Vehicle Replacement;
· Asset Preservation; and
· Fleming Park Lake.
Attachments:
|
1View. |
Annual Budget Overview 2013 2014 |
13/87087 |
|
|
2View. |
2013_2014 Model Budget with carry forwards |
13/87133 |
|
|
3View. |
2013/2014 Capital Works Budget |
13/82073 |
|
|
4View. |
Fees and Charges 2013 2014 |
13/80687 |
|
L.2 Integrated Planning & Reporting Framework
File Ref: 6671 – 13/78962
Responsible Officer: Director, Corporate Strategy and Performance
Disclosure of Interest: Nil
Attachments: 7
Issue
To approve the Strategic Community Plan, Corporate Business Plan and other components of the Integrated Planning and Reporting Framework (IPRF).
Background
The Integrated Planning and Reporting Framework (IPRF) has been introduced by State Government and places a requirement on all local governments to adopt relevant Plans by 30 June 2013. The IPRF has been developed as part of the State Government's Local Government Reform Program; to provide local governments a framework for establishing local priorities and to link this information to operational functions. All local governments are currently required to produce a plan for the future under section 5.56(1) of the Local Government Act 1995. Regulations under section 5.56(2) set out the minimum requirements to achieve this, which prescribes the development of a Strategic Community Plan (SCP) and Corporate Business Plan (CBP).
In developing the SCP, a workshop was held with Elected Members on 31 July 2012, followed by a further report presented to Council Forum on 4 September 2012. A Draft SCP was then presented to Council on 13 November 2012, resulting in the following resolution being adopted:
"That Council:-
1. NOTES the draft Strategic Community Plan, "Building a Future Together" and the summary version;
2. ENDORSES the draft "Building a Future Together" and summary document for community consultation;
3. APPROVES the consultation process as outlined in this report."
The Draft SCP was then advertised for public comment, with the submission period closing 31 December 2012. As a result of the consultation process and further review of the document, various formatting changes were implemented, along with minor grammatical corrections. In addition, the following amendments were introduced to the strategies and objectives within the respective Pillars:
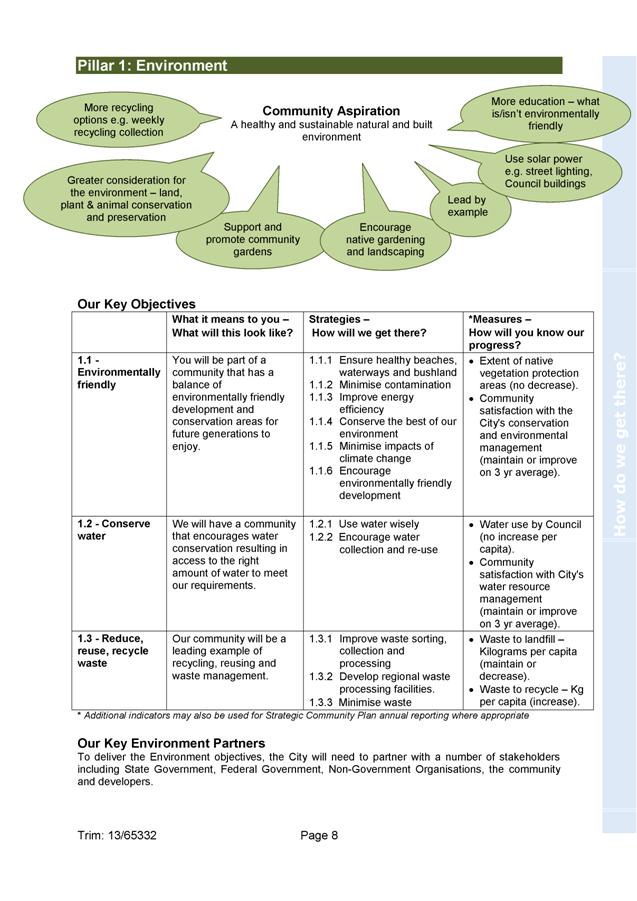
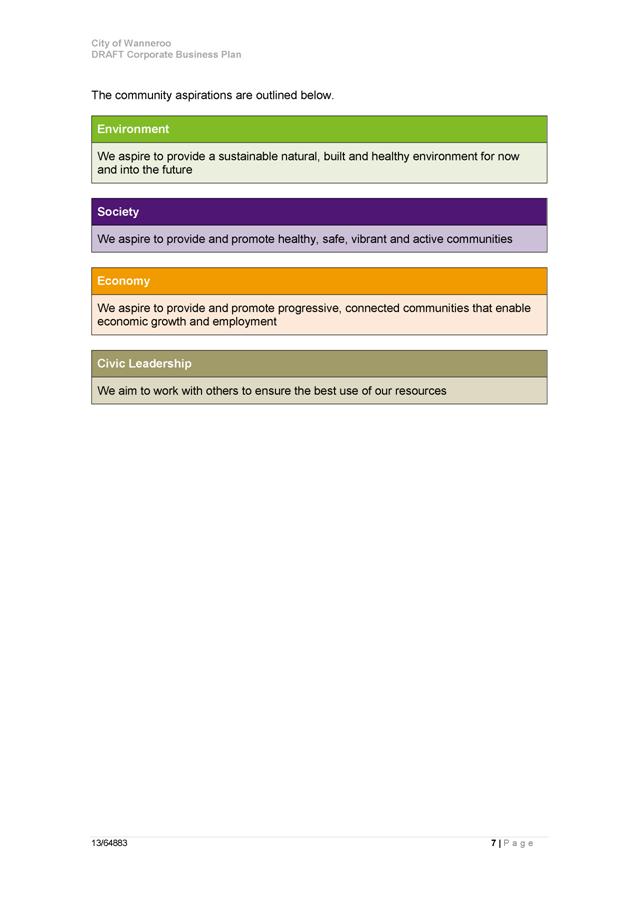
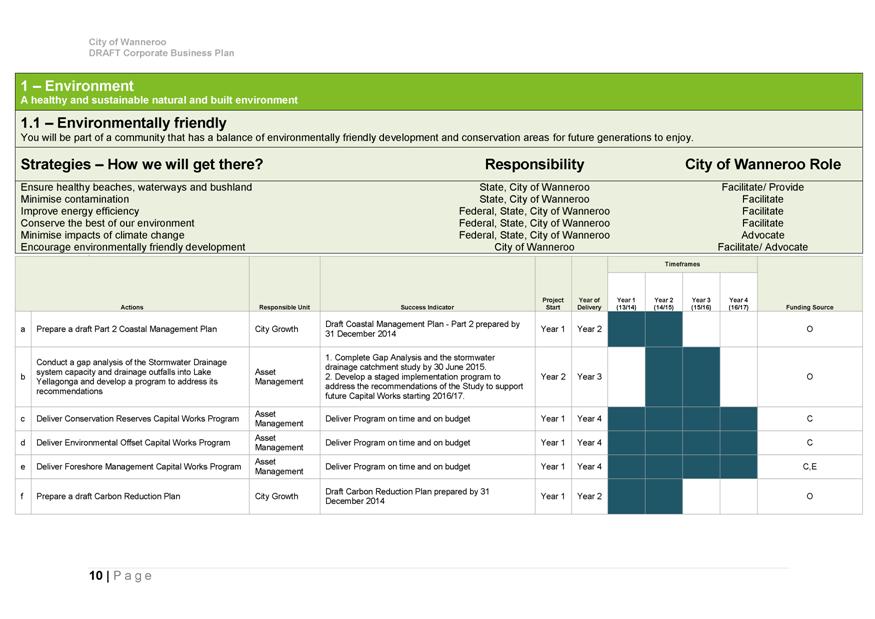
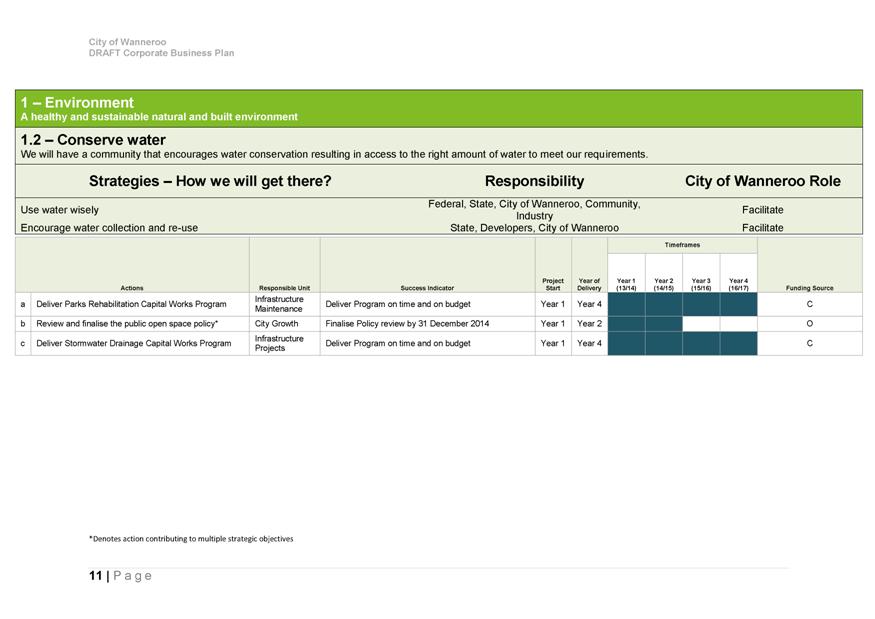
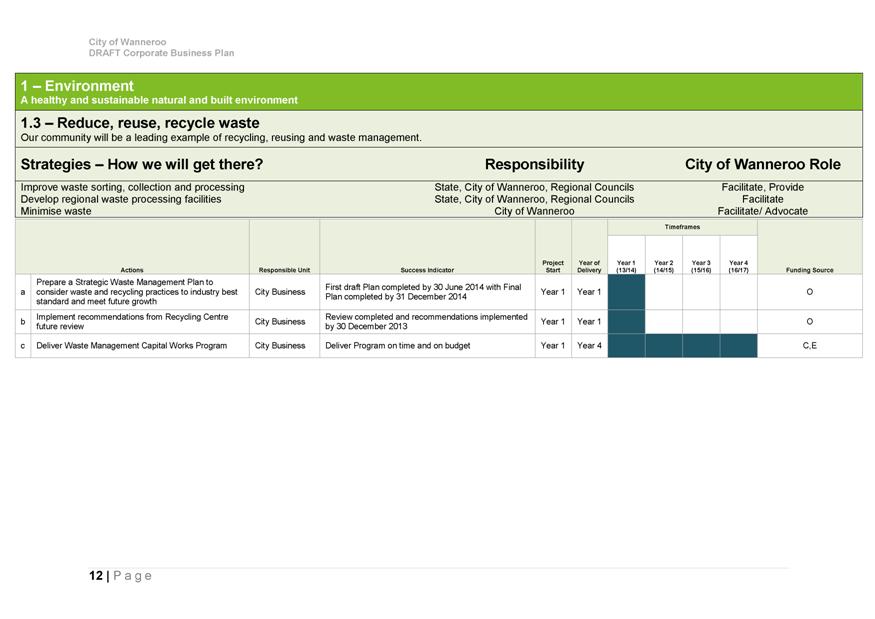
Pillar 1: Environment
· Aspiration changed from 'A sustainable natural, built and healthy environment' to 'A healthy and sustainable natural and built environment'.
· Strategy 1.1.1 amended by replacing the word 'lakes' with 'waterways'.
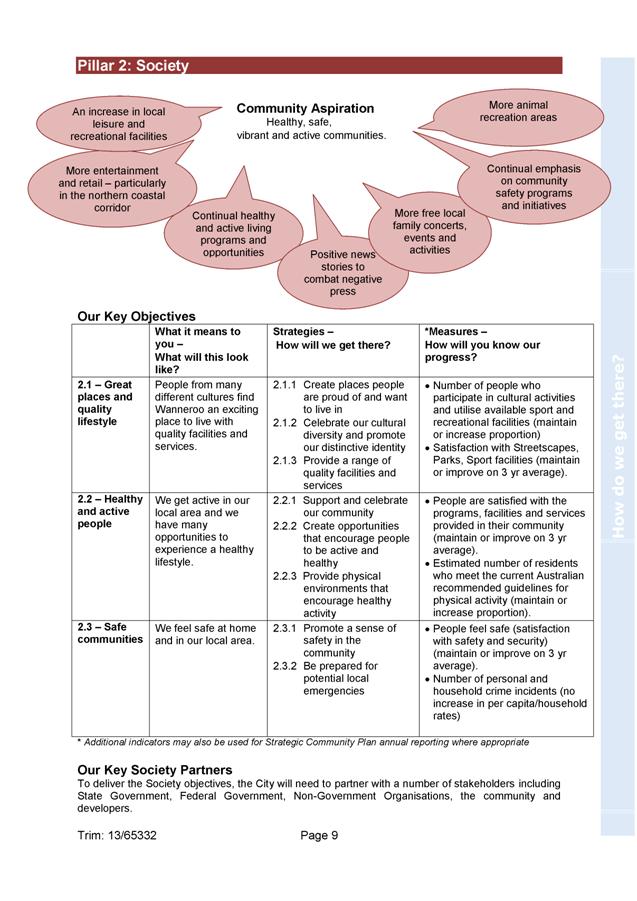
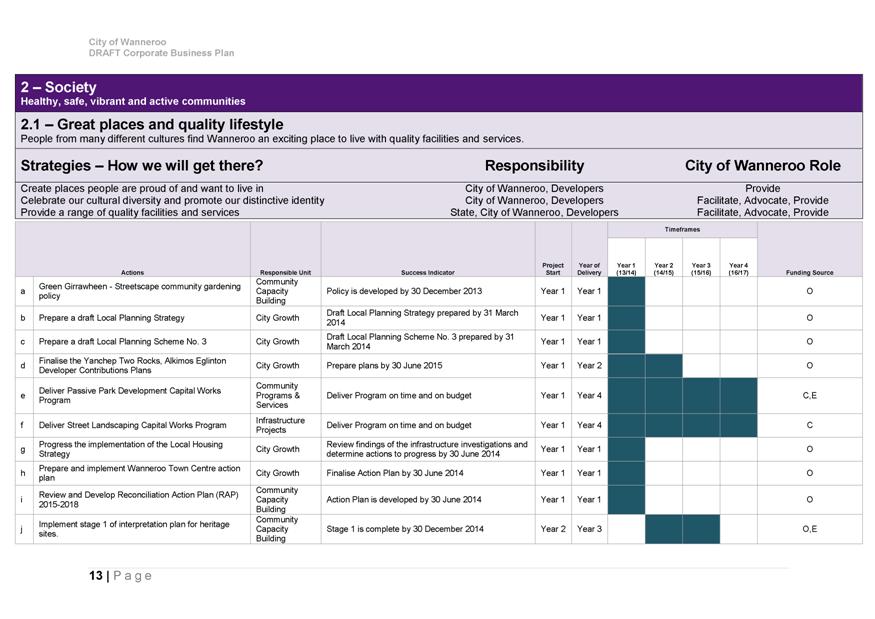
Pillar 2: Society
· Aspiration amended to replace the word 'connected' with 'active'.
· Strategy 2.1.2 amended by replacing the word 'culture' with 'cultural diversity'.
· Strategy 2.2.3 amended by replacing the word 'living' with 'activity'.
· Strategy 2.3.1 amended by replacing the word 'region' with 'community'.
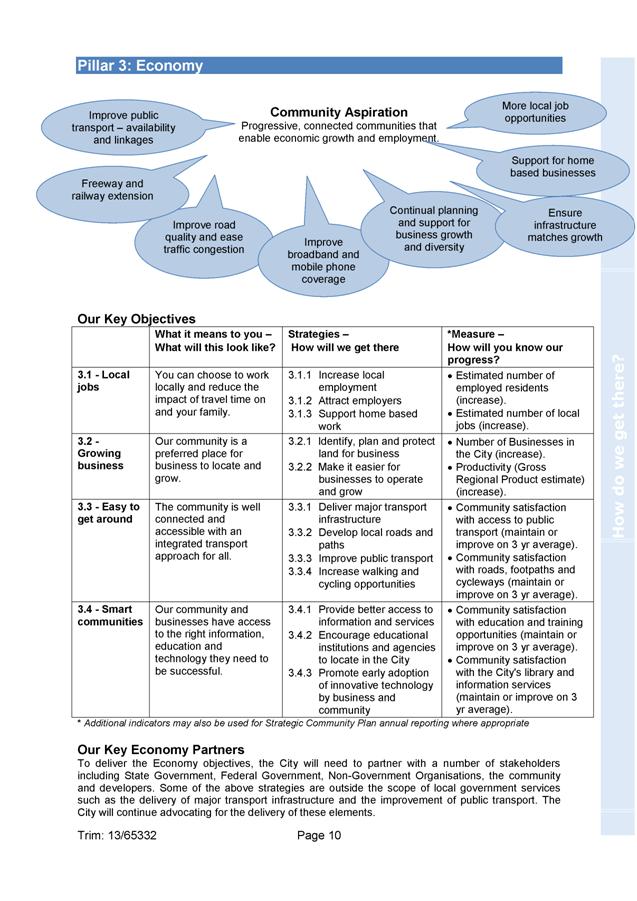
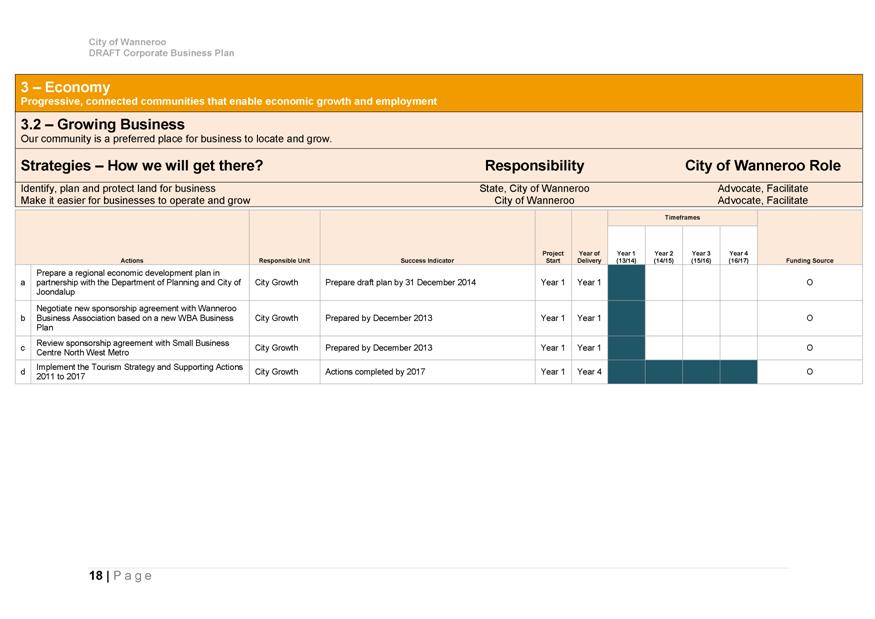
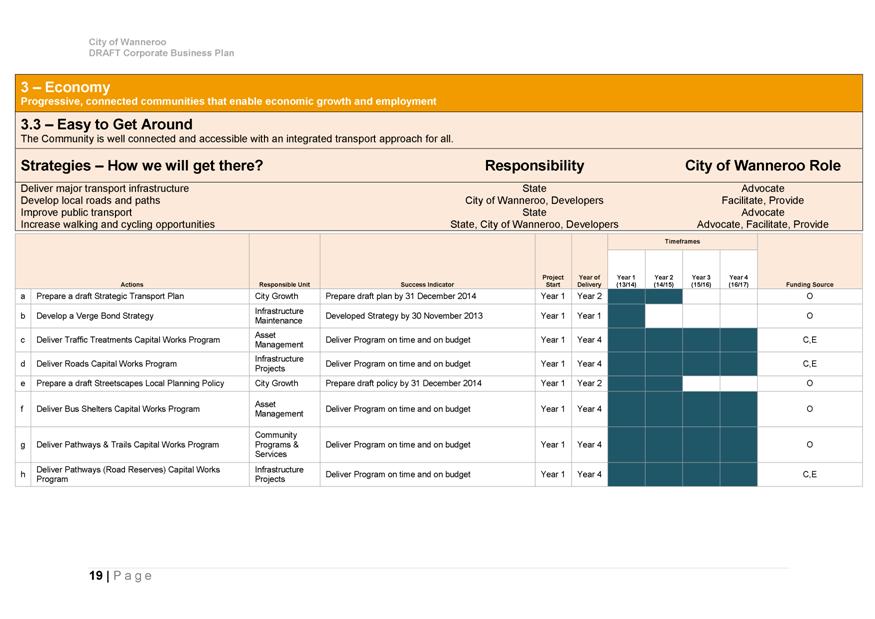
Pillar 3: Economy
· Strategy 3.3.4 added 'Increase walking and cycling opportunities'.
Detail
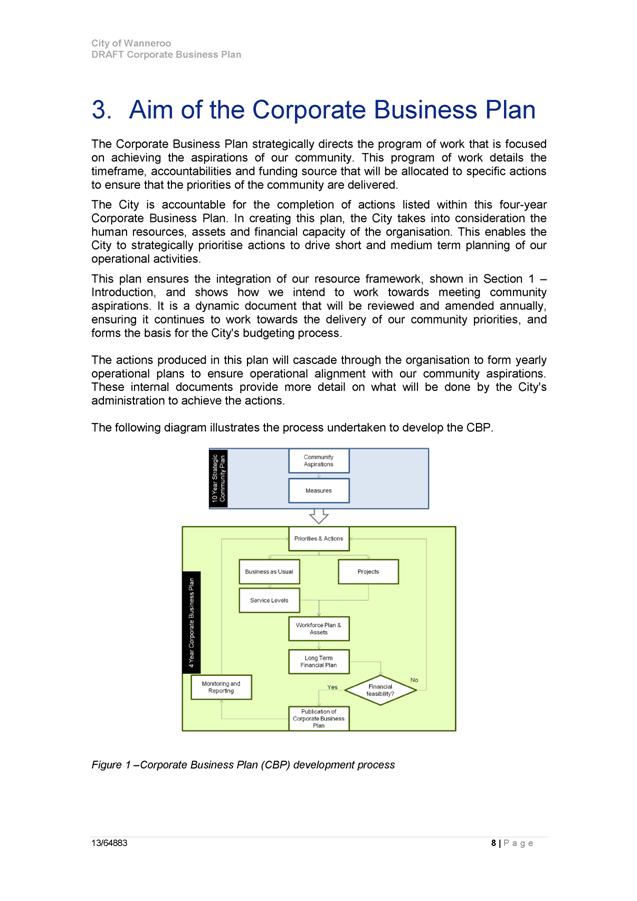
Following the development of the Draft SCP, the organisation has utilised the guidance published by the Department of Local Government to develop the other Plans and Resourcing Strategies required under IPRF:
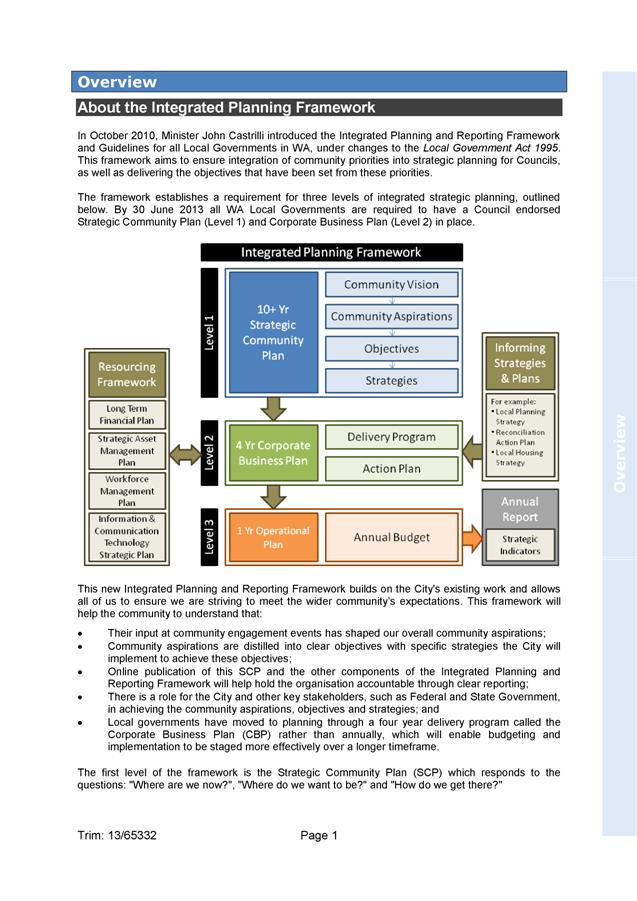
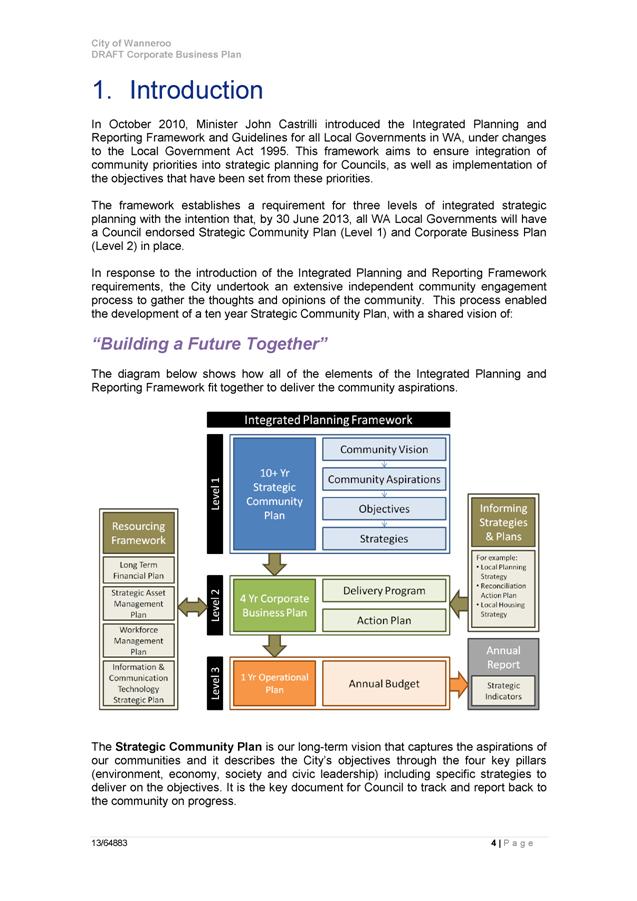
This new integrated framework builds on the City's existing work and ensures that this is geared towards meeting the wider community's expectations and aspirations within the organisation's financial and resource capacity. Importantly, the context for the City must take into consideration the forecast growth, which will see the population of the City of Wanneroo increase from an estimated 175,000 to 249,000 during the 10 Year life of the SCP.

Accordingly, the following draft documents have now been completed, the drafts of which were presented to the Council Forum meeting of 4 June 2013:
· Strategic Community Plan
· Corporate Business Plan
· Asset Management Framework (incorporating Asset Management Policy, Asset Management Strategy and Summary Asset Management Plan)
· Workforce Management Plan
· Long Term Financial Plan
External Assessment of Compliance Requirements
In developing the IPRF, the City engaged Consultants KPMG to evaluate the draft Plans and provide an assessment of the progress towards completion of each IPRF component. The resulting gap analysis provided a basis for identifying the work required to:
- Meet the minimum compliance requirements by 30 June 2013
- Improve the IPRF processes and component Plans in the short term to ensure better alignment and integration (during 2013/14)
As this is the first year of implementation of the new legislative requirement, the City has focused efforts in addressing the gaps identified by KPMG to ensure in the first instance that the minimum statutory requirements of the IPRF are met. The redrafted Plans were then further reviewed by KPMG and confirmation provided to the City that the content of these are in accordance with the requirements. The various Plans are required to be adopted by Council by 30 June 2013.
The status of each key IPRF component and the identified improvements that will be addressed as next steps during 2013/14 and beyond are detailed below:
Strategic Community Plan (Attachment 1)
- Current status
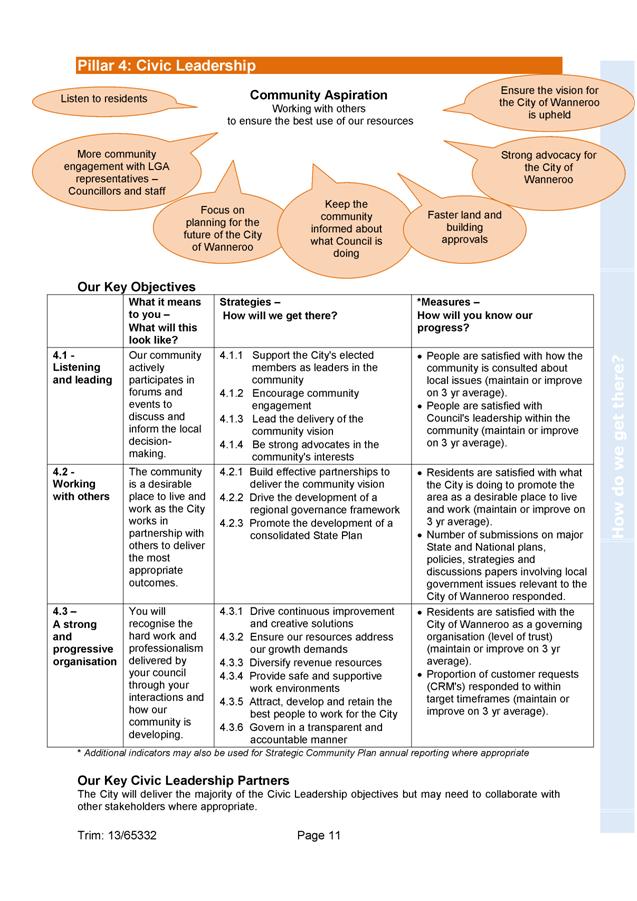
The City's Strategic Community Plan (SCP) Building a Future Together 2013/14 – 2022/23 articulates the community aspirations, with specific strategies which will be implemented to achieve the stated objectives. The development of the SCP provided an opportunity to revisit the overarching vision, objectives and strategies of the previous Strategic Plan 2006-2021 (Revised 2010) in light of feedback from the community, Elected Members, and other stakeholders.
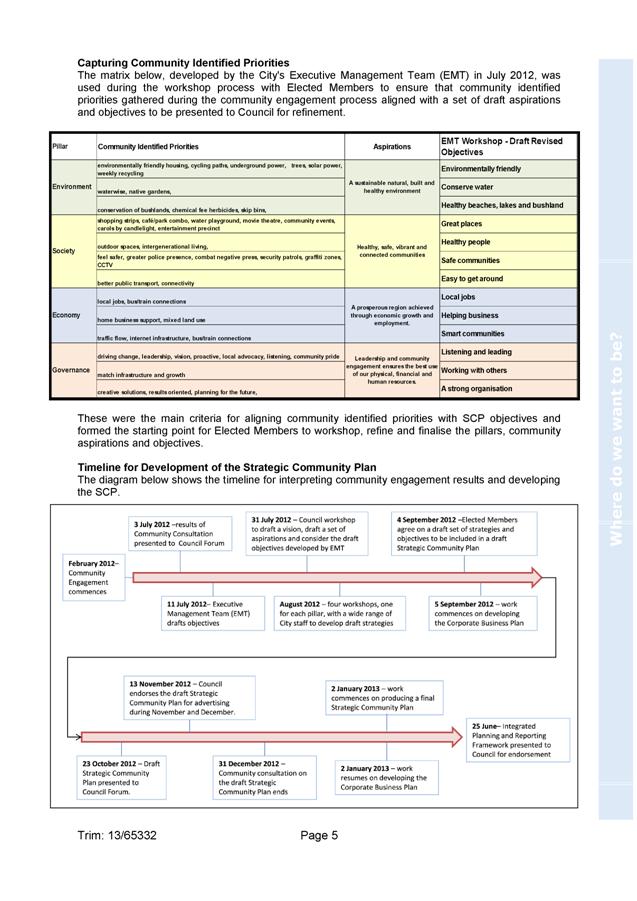
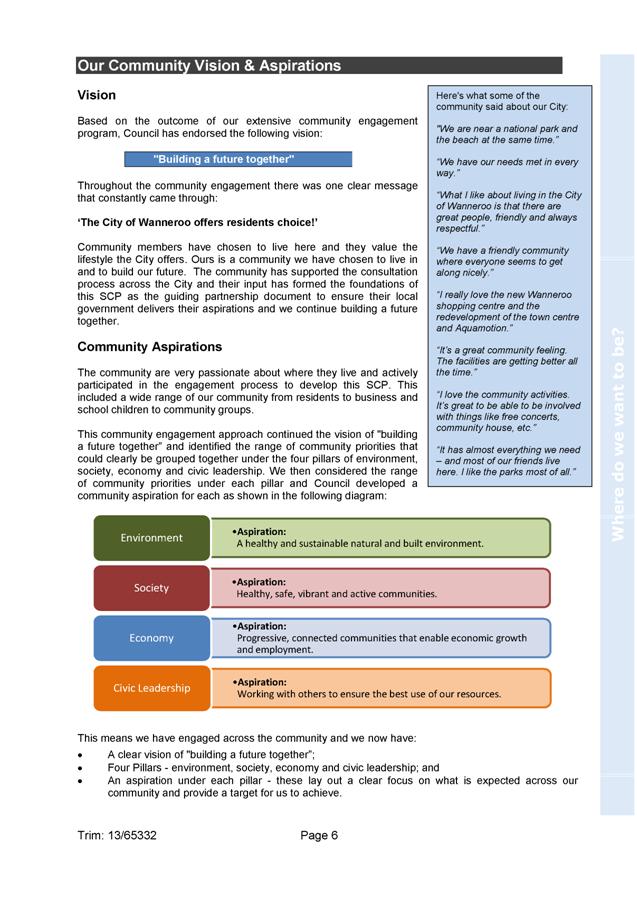
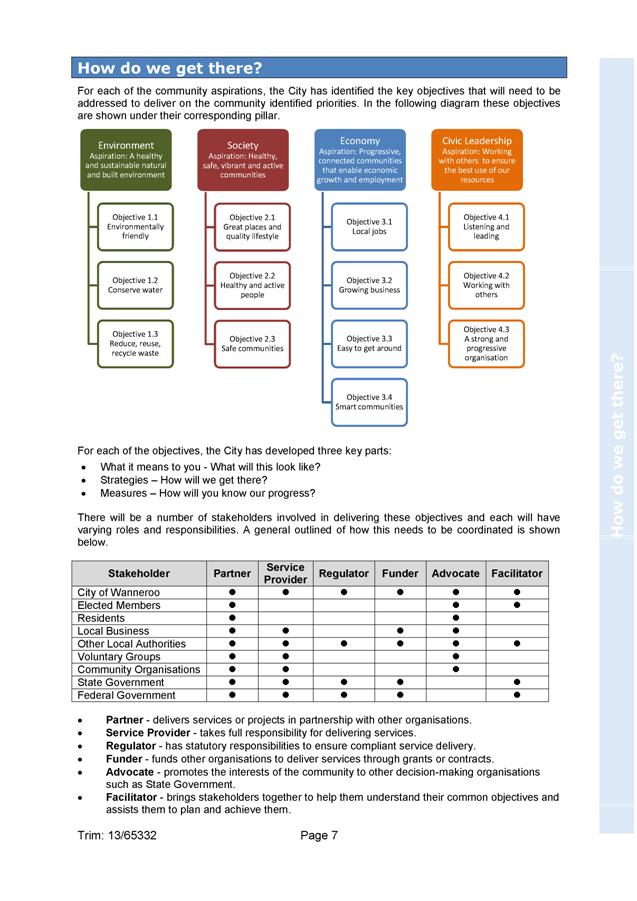
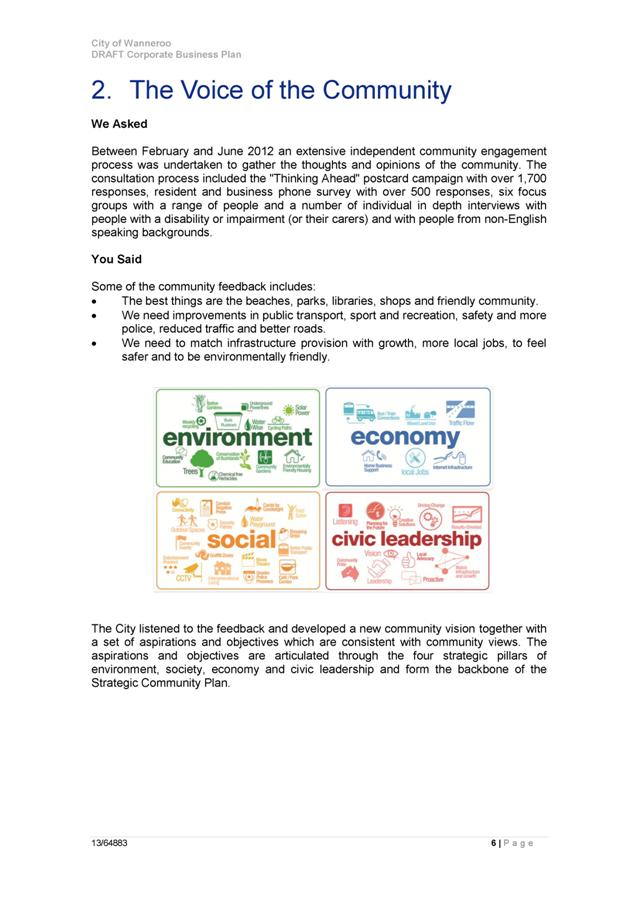
The priorities of the community under the City's vision of Building a Future Together have been grouped into four pillars, being Environment, Society, Economy, and Civic Leadership, as workshopped with Elected Members. Within each pillar is a set of objectives that will be addressed to deliver on the priorities identified by the community.
The SCP informs the Corporate Business Plan. All operational business and projects to be delivered are required to align with the SCP. This approach ensures that the efforts and resources are appropriately directed to achieving the strategic objectives, and in turn the aspirations of the community.
Since the SCP was presented to Council Forum on 4 June 2013, the key change to the SCP has been to review the methodology for measuring and reporting back to the community the achievement over time of the strategic objectives and aspirations.
This has resulted in the addition of two performance measures against each of the objectives within the four pillars of Environment, Society, Economy, and Civic Leadership. These improved measures will enable more comprehensive annual reporting on the City's progress.
- Next steps
Periodic reviews of the SCP will be undertaken in order to adapt our actions to account for any shifts in community expectations and priorities. The SCP will be reviewed within two years and endorsed by Council prior to 30 June 2015. This review will focus on the strategies to ensure that they are still appropriate for achieving the community objectives.
A full review of the SCP will be undertaken within four years in accordance with the requirements of Regulation 19C (4) of the Local Government (Administration) Regulations 1996 and presented to Council by 30 June 2017. This will include going back to the community to test whether the vision, aspirations and objectives need to be changed in light of any changes to community priorities or capacity changes on the part of the City.
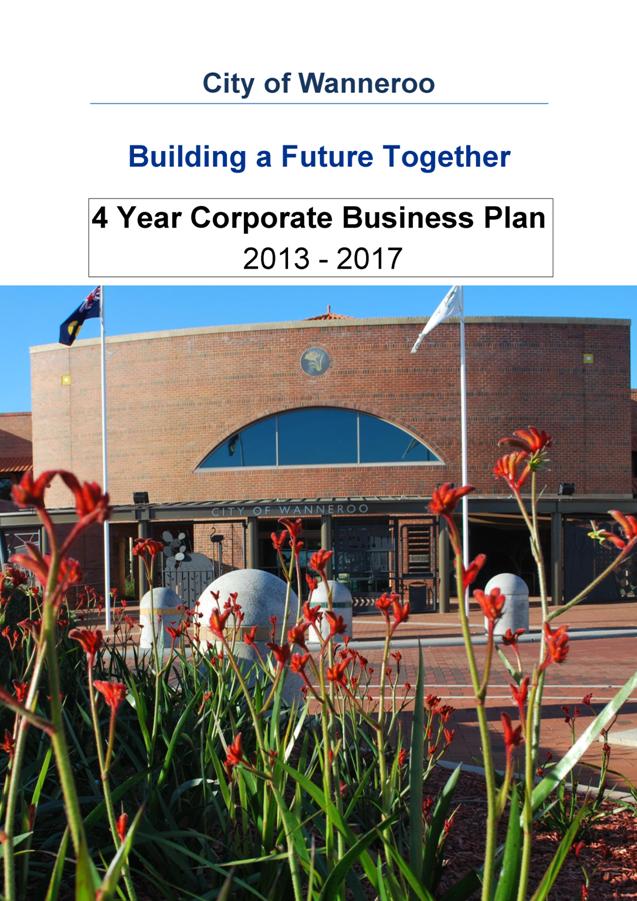
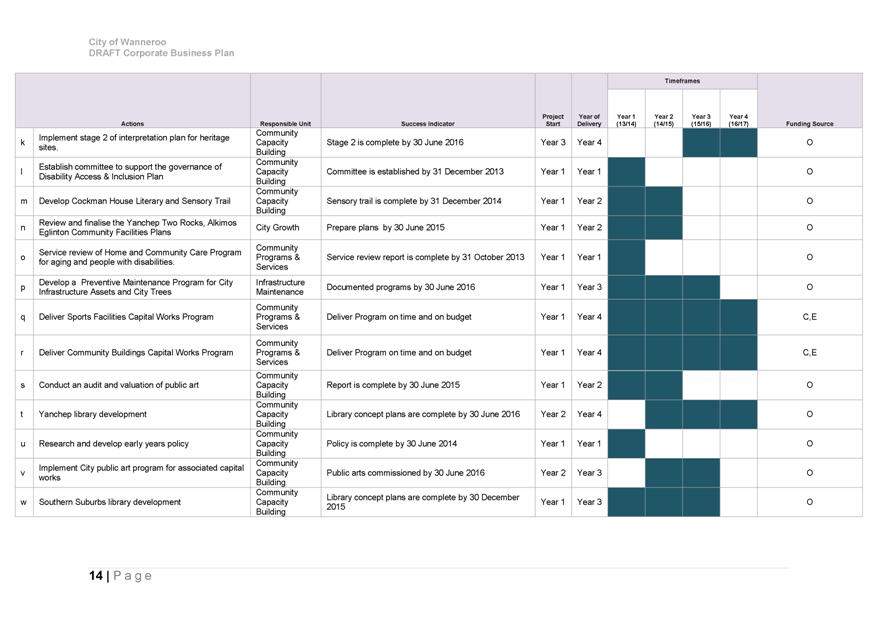
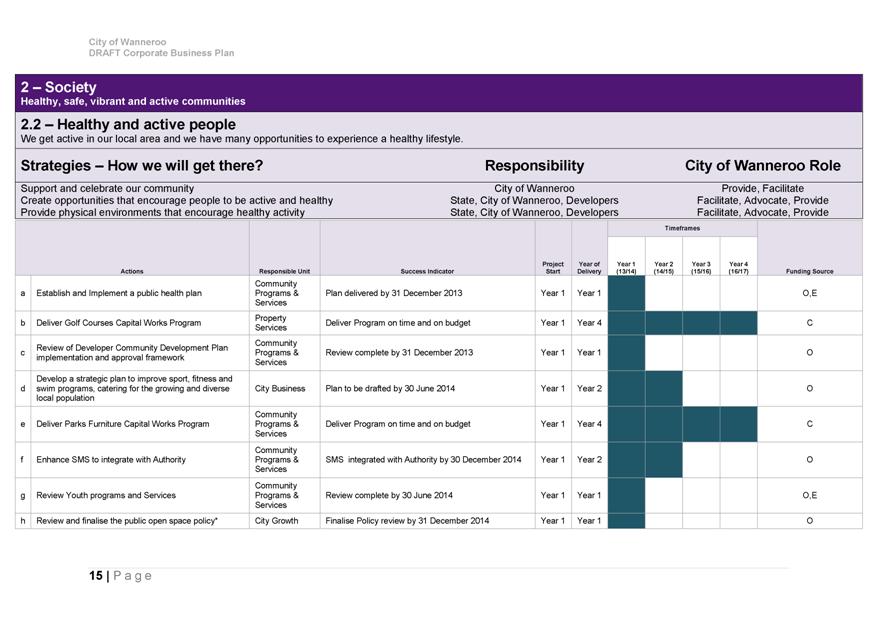
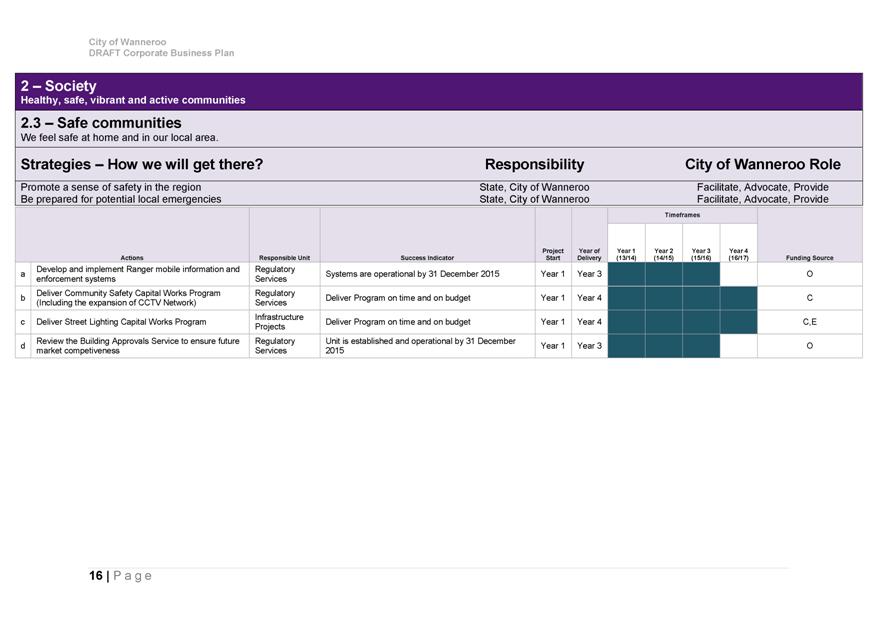
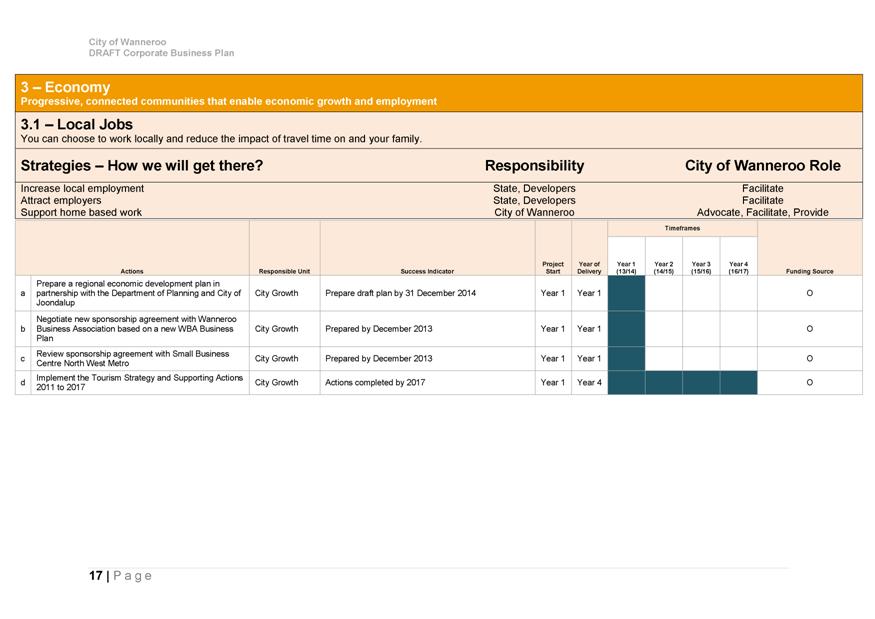
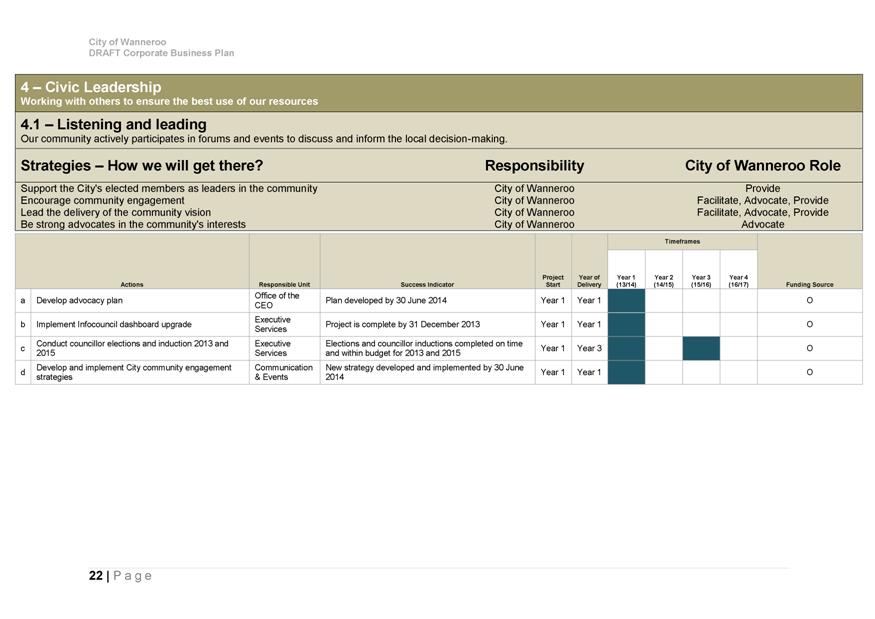
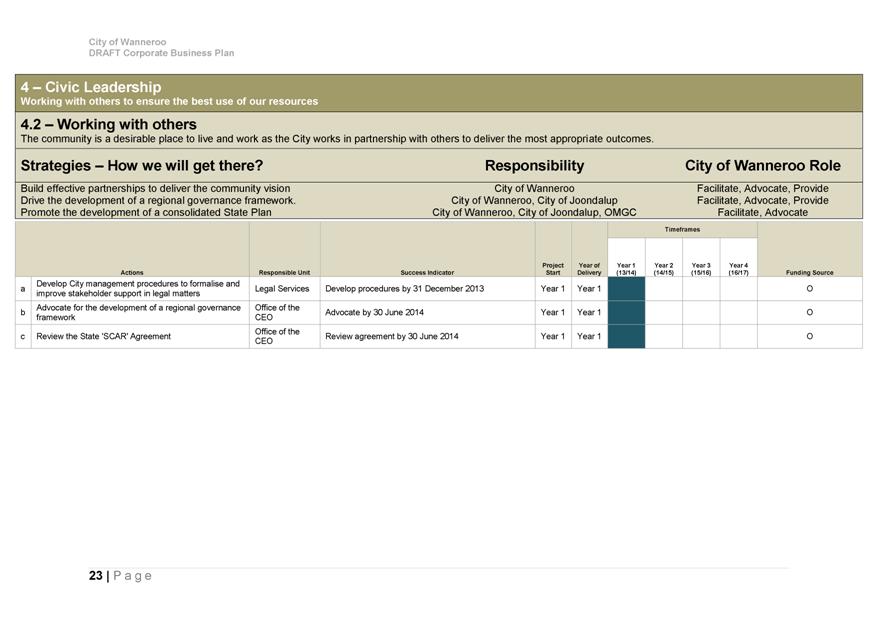
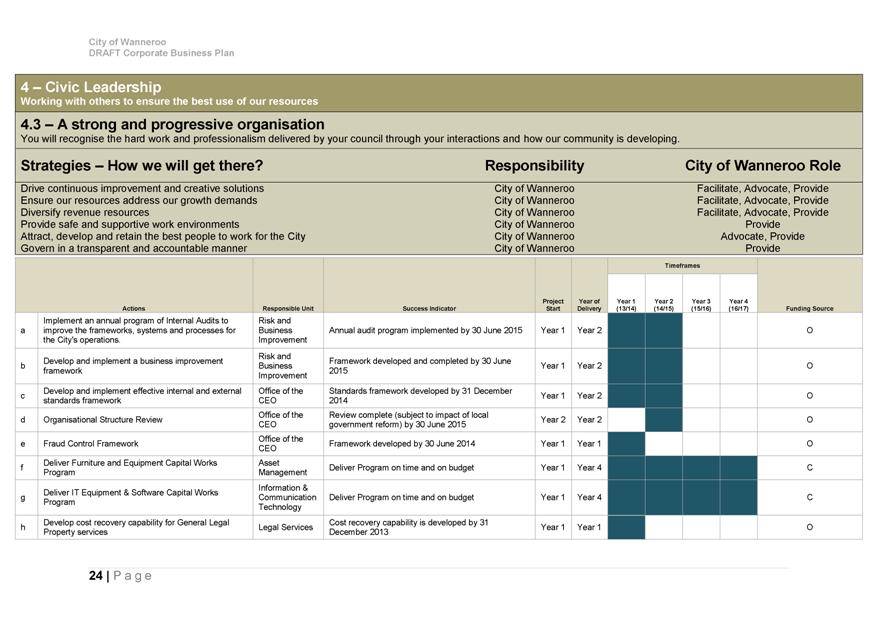
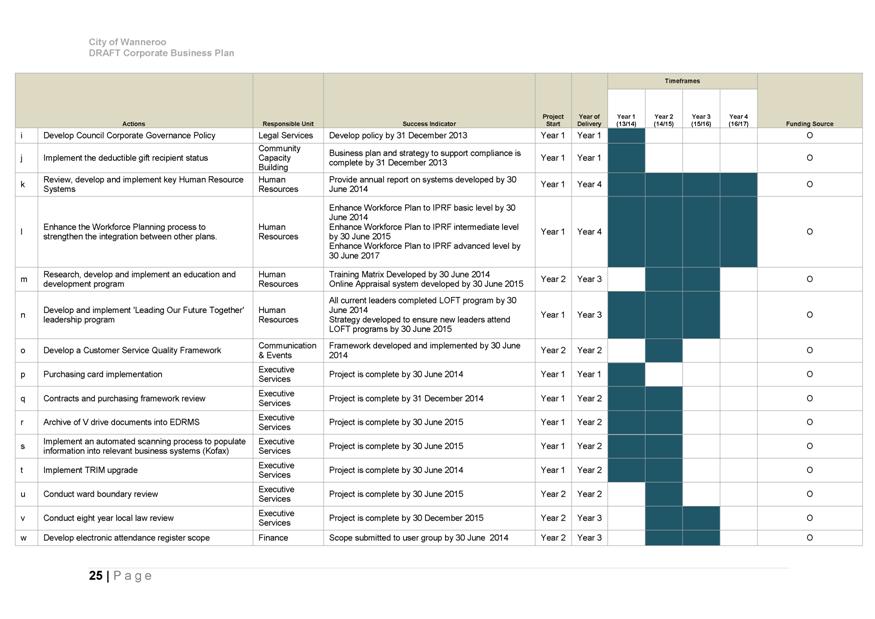
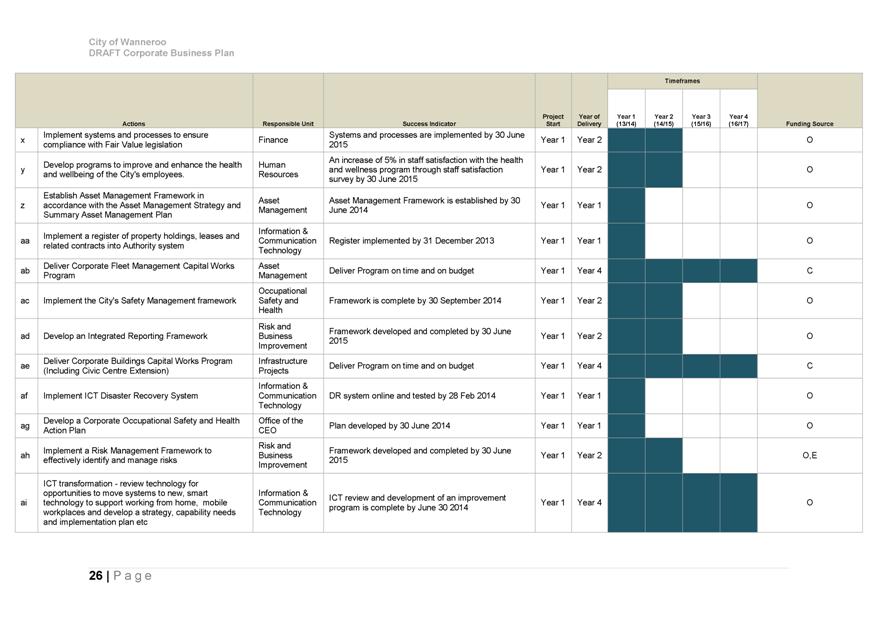
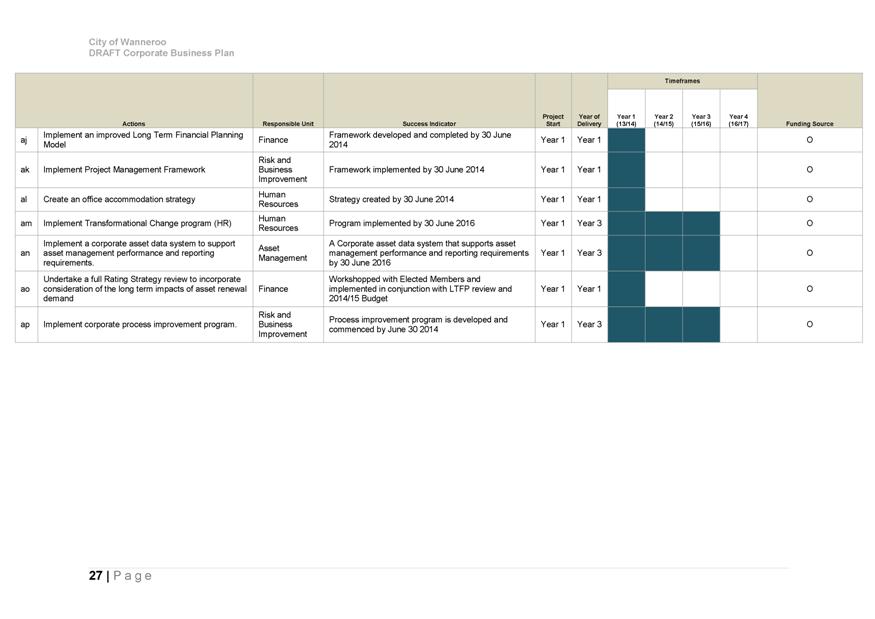
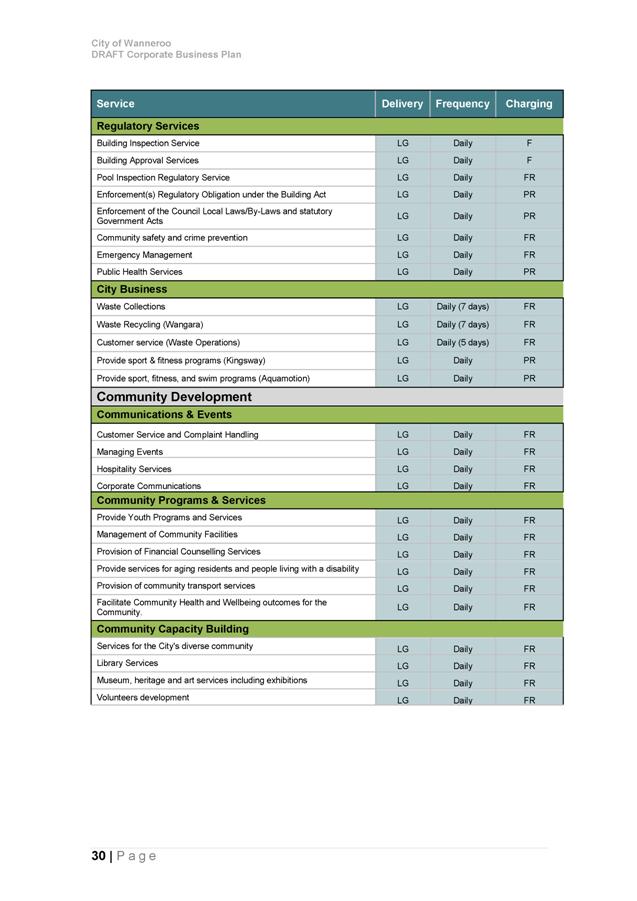
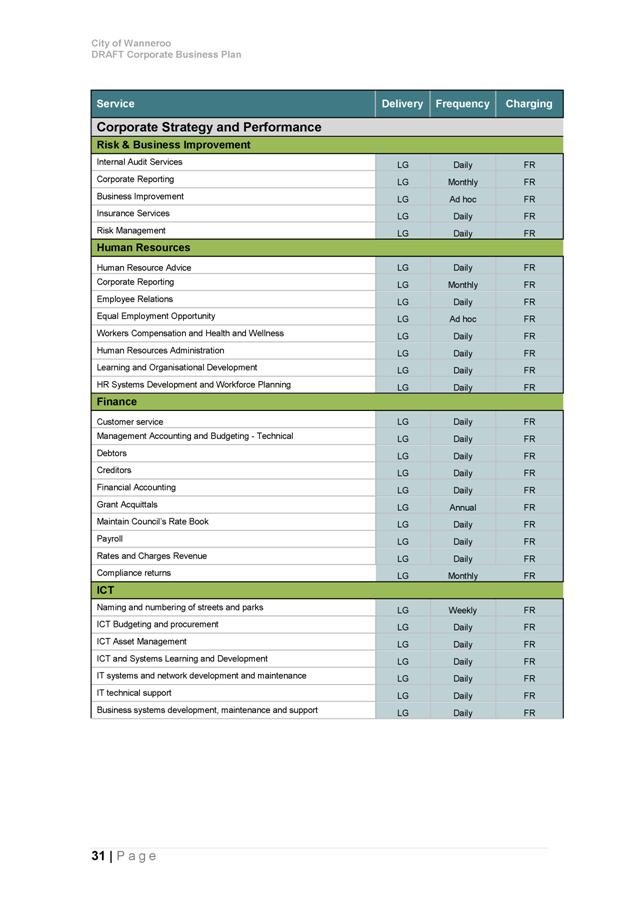
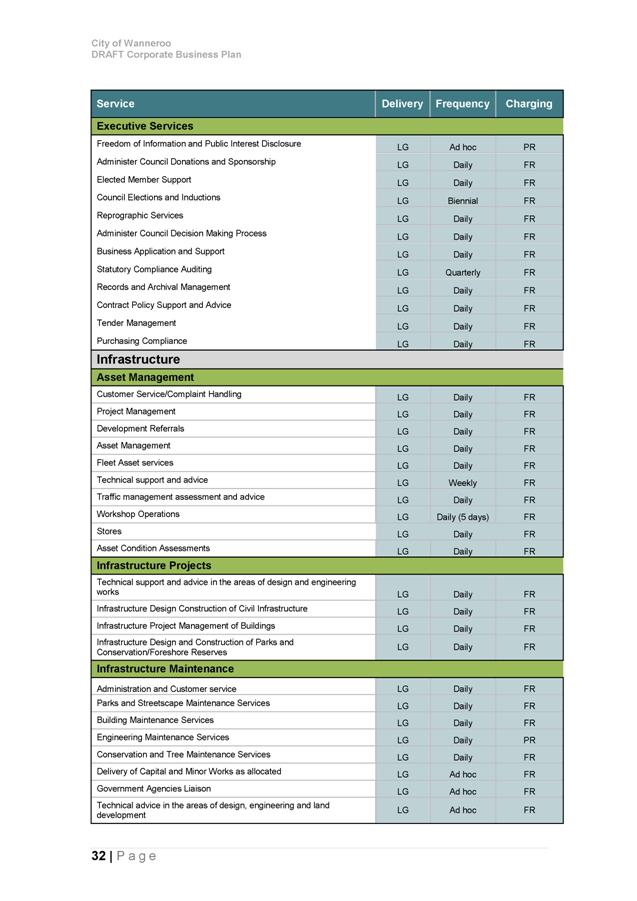
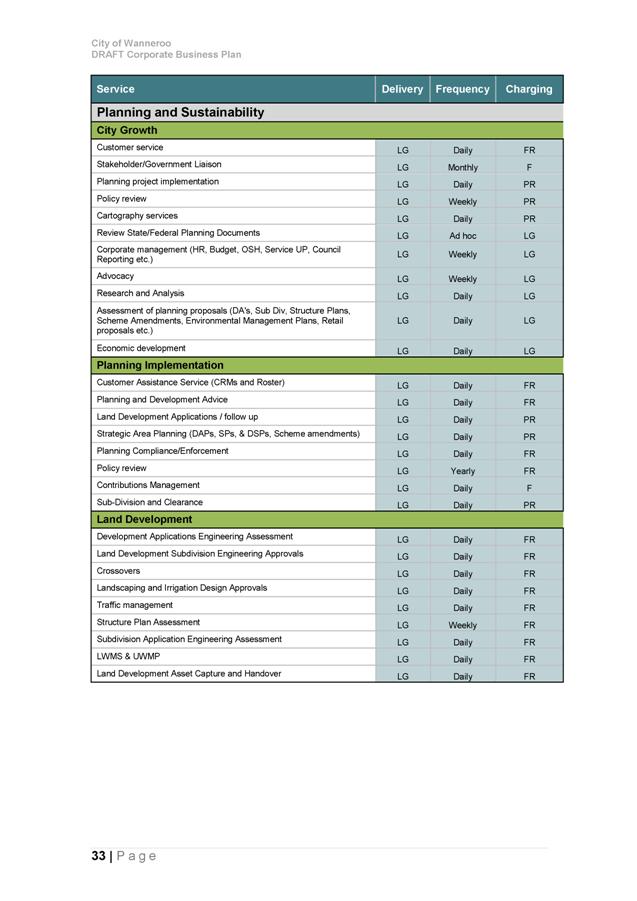
Corporate Business Plan (Attachment 2)
- Current Status
The Corporate Business Plan (CBP) details the City's priorities and actions for achieving the objectives and aspirations of the community as set out in the SCP. Essentially it operationalises the SCP and becomes a delivery plan. It is at the heart of the IPRF as it informs, and must take into account, all other components of the framework including the:
o Workforce Plan (WFP)
o Assets Management Plans
o ICT Strategic Plan
o Long Term Financial Plan (LTFP)
The CBP is essentially a contract between the CEO and the Elected Members that states how the City will activate the SCP. It aims to provide transparency and greater accountability by informing the community of the City's commitments.
The CBP comprises two key aspects; these being one-off projects and the business as usual operational activities that will be delivered over a four-year period. The Corporate Business Plan directly informs the development of the Workforce Plan by quantifying the level of human resource that will be required to deliver on projects and operational activities and the development of the Long Term Financial Plan. This move from an annual to a four-year delivery plan through the Corporate Business Plan enables more effective budgeting and project implementation over a longer timeframe.
The development of the CBP provides in a single source document the extent of activity being undertaken in terms of day to day service delivery, along with an ambitious list of new projects to be delivered each year. The review by KPMG highlighted pressure points within the organisation where there appears to be a heavy reliance on the goodwill of employees to deliver the projects along with business as usual activities. A lack of consistently mapped corporate processes means that the City lacks a true understanding of the baseline resourcing levels which in turn impairs the City's ability to accurately identify opportunities for process efficiency or to purposefully plan workforce requirements.
Since the CBP was presented to the Council Forum of 4 June
2013, the key change to the document has been to amend the format that the
priority projects and actions are presented. These are now listed without the
dollar figures and instead, an indication of when the projects will be
delivered, together with their funding source is detailed.
- Next steps
Critical improvements to the ongoing development of the CBP are:
- Prioritise the understanding of core business outcomes and the mapping of corporate processes. This will:
o provide a sound baseline for understanding the human resources required to support business delivery, and where processes can be made more efficient.
o build capacity within the City.
- Introduce one single point of coordination and oversight of projects:
o the implementation of a Project Management Framework will enable improved end to end project governance, controls, accountability, planning and budgeting in relation to projects.
o this is essential if the City is to have clarity on how we activate the SCP and in turn understand the true levels of human resourcing and financing required.
The CBP will be reviewed, reprioritised and reported on annually to provide information to the community and statutory bodies on the City's progress in delivering services, projects and other operations to meet the community's short term, medium term and long term aspirations. The CBP will evolve as a rolling four-year Plan which generates the annual budget and informs the Resourcing Plans described below.
RESOURCING FRAMEWORK
Workforce Plan (Attachment 3)
The Workforce Plan (WFP) is a resourcing strategy which coordinates the human resource requirements for delivering the City's operations. The WFP aligns with the operational and project priorities of the CBP to ensure the workforce needs and limitations are addressed. The WFP also details strategies for addressing both the present and anticipated workforce issues.
The WFP has been developed through:
- Analysis of internal and external environment and workforce
- Workforce implications of the SCP and CBP
- Growth projections and strategies to meet future workforce needs
Since the WFP was presented to the Council Forum of 4 June 2013 a number of changes have been made. These have been to finesse the format and grammar within the document, and to include a section that identifies the key human resourcing risks for the City and how these have been addressed through the WFP strategies.
Next steps
As the WFP derives information of the human resource requirements from the services and projects detailed within the CBP, ongoing work will be required to maintain and improve these linkages as the CBP is amended in the future. As a resourcing baseline for the delivery of business-as-usual services has not been established, this will aid the costing of changes to services subject to the City's population growth.
The work to establish the baseline will be informed thorough understanding core business processes, and the required human resources to deliver these at particular levels of service.
It will also be important to review and strengthen the alignment and integration of the WFP with the Asset Management Plans and ICT Strategic Plan. In particular, the linkages of human resource strategies with those strategies which incorporate the City's future growth, changes in the external environment, internal business processes, assets such as office accommodation, vehicles, office equipment and the opportunities from technological resources such as devices, hardware/software and systems. This will ensure that the human resource strategies maximise opportunities and address the challenges in each of these areas.
Strategic Asset Management Plan
- Current Status
The City has an ongoing commitment to sustainable asset management and has previously adopted an Infrastructure Asset Management Policy and Asset Management Plans for most of the City's Infrastructure assets. The IPRF, however requires a more comprehensive and integrated approach. Given the scale of the City's operation, it has been determined that addressing the requirements of the IPRF can best be achieved through the adoption of an Asset Management Framework.
The components of the Framework that are presented for adoption include:
· Asset Management Policy (Attachment 4)
This policy will supersede the existing Infrastructure Asset Management Policy and provide overarching key principles against which assets are to be managed. This will ensure there is an organisation-wide commitment to asset management, and the framework and objectives for the development of the AM Strategy and AM Plans.
· Asset Management Strategy (Attachment 5)
The Strategy sets asset management objectives, practices and strategies for the improvement of the asset base and the asset management system, and drives the entire asset management process. It ensures the objectives of the AM Policy one implemented, and provides the management framework to enable the implementation of detailed Asset Management Plans.
· Summary Asset Management Plan (Attachment 6)
This document summarises the outputs from the detailed AMPs on the long term asset renewal demand predictions and provides the link to the long-term financial planning and strategic planning. This Plan also brings together the corporate requirements such as Levels of Service and AM Data and Systems from the various detailed asset management plans and improvement planning summaries.
Since the Council Forum of 4 June when these documents were presented, they have been further reviewed, and a number of minor changes made. These changes have been primarily to the grammar and formatting, in order to improve the clarity and readability of the documents.
- Next Steps
The City is currently developing its asset management capacity and capability; Asset Management Plans currently focus primarily on infrastructure assets however, and exclude other asset classes such as ICT, Plant, Fleet, and Land.
The City will therefore review and consider a consistent approach and common corporate framework for the management of all assets, including consistency in the asset registers across all asset classes. Asset renewal demand should be integrated as a critical and mandatory consideration in all financial and capital decision making as this is key financial information for asset management strategies and the Long Term Financial Plan. In addition, processes to ensure that asset projects incorporate "whole of life" project costing for upgrades or new assets will ensure that the CBP and budget / Long Term Financial Plan are developed with accurate information.
The Asset Management Strategy outlines a range of tasks and strategies dealing with areas of accountability, integration, lifecycle management, standards and levels of service. These will need to be assigned, prioritised and progressively implemented. In addition, further analysis is required in terms of the long term financial impact of the predicted renewal program and funding strategies considered for integration into the City's long term financial planning.
ICT Strategic Plan
- Current Status
The City is currently developing an Information and Communication Technology (ICT) Strategic Plan which presents the City's approach to planning for, and managing, technology to improve business operations and ultimately service delivery to the community. The ICT Strategic Plan is not a legislative requirement of the IPRF (and is not included for adoption) however as a key contributor to productivity and a critical enabler of business, it is seen as a significant component of the City's overall framework for planning and reporting.
- Next Steps
Through the ICT Strategic Plan, a comprehensive evaluation of the technological opportunities to support the medium to longer term strategies of the WFP – such as the enabling of smart workplaces - and improvements to internal operations and service delivery will be undertaken. This will be achieved through understanding business processes and operational requirements. This is also coupled with an appreciation of the strategic requirements of the organisation and an exploration of appropriate ICT solutions to enable business process improvement and to support our business into the future. By maximising the appropriate use of ICT solutions the City may also reduce the demands on additional human resourcing that is required, with potential for increased efficiency.
Long Term Financial Plan (Attachment 7)
- Current Status
The City has developed a Long Term Financial Plan (LTFP) which is a 10-year rolling plan that draws from the Workforce Plan and Asset Management Framework, and informs the Corporate Business Plan to activate Strategic Community Plan priorities. The LTFP provides an indication of the City's long term financial sustainability to enable early identification of financial issues and their longer term impacts. The estimates and projections of the LTFP have been developed based on the City's business activities, financial commitments, community priorities and a set of assumptions (which include factors such as population growth, inflation forecasts, and revenue streams).
The City's financial resilience has been improving through successive budgets and the draft LTFP presents a reasonably strong position. Initiatives such as the Community Facility Plan and proposed Development Contribution Plan provide significant opportunities to improve the City's financial sustainability by reducing the demand on Municipal capital funding.
This is offset, however in the longer term by operational requirements, including significant asset management responsibilities. It is important therefore that strategies are developed with a much longer-term perspective than the 10 years covered by the LTFP.
The 10 Year Capital Works Program is linked to the LTFP and included in the current documents. For Elected Member information, there have been no changes to the 10 Year Capital Works Program 2013/14 – 2022/23 as presented to Budget Workshop 3 other than those reported at the Council Forum on 4 June 2013, being:
Community Buildings: increase Furniture Replacement Program in Year 1 (PR-2203) from $30,000 to $80,000.
Pathways: delete Marmion Avenue pedestrian underpass project in Year 4 ($50,000).
Roads: add Access Road to Yanchep Active Open Space (YAOS) in Year 1 ($850,000) to reflect Council's committed contribution to road construction.
Sports Facilities: Increase budget for Yanchep/Two Rocks Playing Fields in Year 2 from $2,280,000 to $3,240,000 to correctly reflect potential cost of the YAOS project.
Since the LTFP was presented to the Council Forum of 4 June 2013 minor grammatical and formatting changes have been made to the document. Additional information has also been included, these being changes to the following areas:
o Statement of Cash Flow (as part of the IPRF compliance requirement);
o Information about a review of the City's Rating Strategy by external consultants, the findings and recommendations of which will be workshopped with Elected Members during 2013/14;
o A section on risk assessment which identifies the prevailing global and local economic, legislative, social and environmental considerations;
o A Disclaimer to protect the City's interests in relation to the reliance and use of the information provided in the document by third parties.
- Next Steps
The City will focus efforts on strengthening the processes, systems and knowledge of planning for whole of life costing for operating and capital projects. Improvements to the financial planning model will be made to enable scenario modelling, such as the impact of introducing individual projects, with whole of life costs and the impact on rates over the longer term, or modelling for different scenarios of growth, and to enable sensitivity analysis testing.
The Long Term Financial Plan will be reviewed in conjunction with reviews of the Strategic Community Plan. This will involve a desktop review every two years (or annually prior to development of the Annual Budget) and a full review undertaken every four years. Importantly, reviews will need to progressively consider strategies to address the long term implications of predicted asset renewal demand.
Improvements to IPRF processes
It is recognised that there is room for further improvement to IPRF content and processes employed by the City. This will maximise the opportunity to apply the framework as a tool that drives improved planning, prioritised budgeting, and ultimately the longer term sustainability of the organisation whilst ensuring alignment to aspirations of the community. The opportunity for this lies in exploring improvements and the work required to:
- Embed IPRF processes as part of 'the way we work' so that it is not a bolt-on to business as usual, but an integral part of it;
- Undertake a comprehensive corporate change program to address business process inefficiencies and improve capacity and productivity;
- Implement improved governance and assurance frameworks particularly around projects;
- Undertake a comprehensive review and evaluation of the technology that is required to support improved business processes, and the opportunities of technological advancement to enable business improvement, achievement of strategies (such as workforce strategies) and to support the anticipated growth of the organisation.
Consultation
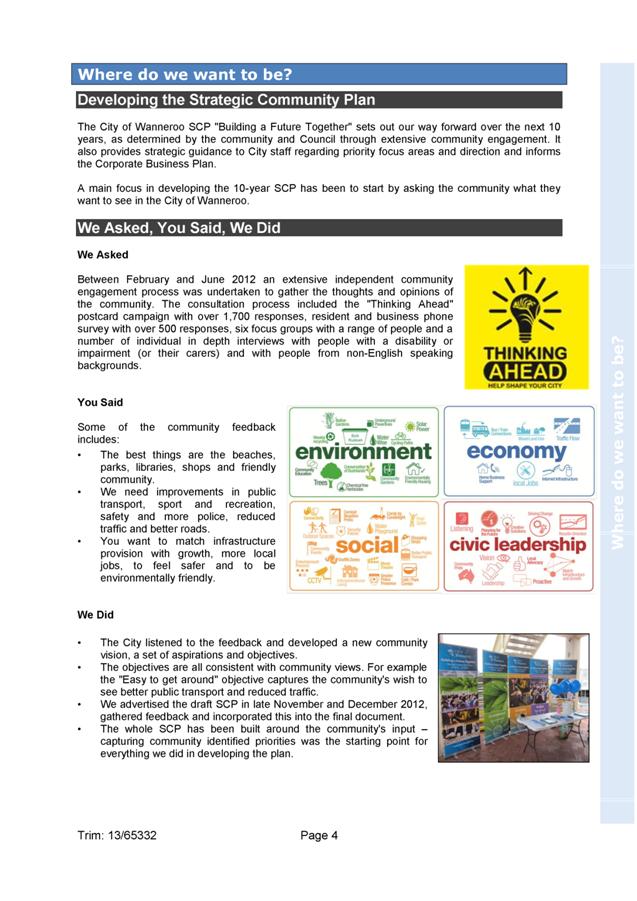
Extensive consultation has been undertaken throughout Wanneroo's diverse community in the development of inputs to the Strategic Community Plan which included the following key elements:
· Thinking Ahead Marketing Campaign – posters, bus signage, media advertising and giveaways to raise awareness of the integrated planning process.
· Post Card Campaign - distribution of reply paid postcards through shopping centres, sports venues, Clarkson Rail Station, playground, libraries and community programs – which elicited 1,781 responses.
· Resident phone survey – undertaken by Catalyse Market Research – which elicited 403 responses.
· Business phone survey – undertaken by Catalyse Market Research – which elicited 126 responses.
· Focus Groups – two with youth aged 12 – 24; one each with young families, older families, adult singles/couples with no children at home, seniors 55 plus.
· In depth interviews – with people with a disability or impairment or their carers; and with people with a non-English speaking background.
Further consultation occurred when the Draft Strategic Community Plan was published in November 2012, the results of which have been incorporated into the latest Draft of the Plan.
The adoption of the Strategic Community Plan will necessitate publication of a Local Public Notice informing of the availability of the SCP. It is proposed that all of the components of the IPRF would be publicly available on the City's website.
Any significant changes arising from reviews of these documents in subsequent years are required to be reported back to the community and to be tested against community aspirations.
Comment
Whilst the City has developed the IPRF to ensure statutory compliance, it is recognised that the scale of activity will require improvements through successive versions. It is however considered to be an excellent launch into the process. Importantly, the components meet the requirements of legislation. It should be noted however the City's scorecard in terms of the various ratios prescribed reflect a mixed result, generally due to the unique growth rate experienced and impact on the City's asset base.
The task of developing and integrating the components of the IPRF has been particularly informative and enlightening and has identified the need to consider fundamental changes and improvements to facilitate operational efficiency and effectiveness.
Through the growth of the organisation, the City has placed heavy reliance on the goodwill of employees to deliver on services and projects to an expanding community. This coupled with processes that are not always optimised and ICT systems which may not adequately support business requirements into the future (given the City's growth projections), means the organisation could struggle to continue to grow efficiently and sustain the required level of outputs.
In order to establish an organisation that is geared to the requirements of servicing a much larger community, it is proposed to implement a transformational change program initially to the corporate areas and systems of the organisation. This process will need to be balanced with continuing to maintain the delivery of business as usual activities.
Further consideration will need to be given to the implications and requirement to defer some discretionary projects during the period of this program to create the necessary capacity within the organisation.
Statutory Compliance
The development of the Integrated Planning and Reporting Framework is a legislative requirement of local governments. Specifically, it is prescribed by section 5.56 of the Local Government Act 1995 (Planning for the Future) and Division 3 of the Local Government (Administration) Regulations 1996.
Strategic Implications
The proposal accords with the following Outcome Objective of the City’s Strategic Plan 2006 – 2021:
“4 Governance
4.6 Provide and maintain a high standard of governance and accountability”
Policy Implications
The continuous improvement in the City's Integrated Planning and Reporting Framework will have implications across a range of policies, with the first being the replacement of the existing Infrastructure Asset Management Policy with a more comprehensive Asset Management Policy.
Financial Implications
The introduction of the LTFP does not of itself impose financial implications, in fact its purpose is to provide greater clarity and transparency of decision making on long term capacity and financial sustainability.
Implementation of a Transformational Change Program to introduce improvements to efficiency and effectiveness of corporate processes and ICT systems will have a budgetary implication; however this will depend on the scale and staging of the activity. Further planning is required in this respect to work within current budgetary provisions.
Voting Requirements
Absolute Majority
Recommendation
That Council:-
1. By absolute majority Adopts the 10-year Strategic Community Plan 2013/14 – 2022/13 'Building A Future Together', as detailed in Attachment 1;
2. By absolute majority Adopts the 4-year Corporate Business Plan 2013/14 – 2016/17 as detailed in Attachment 2;
3. ADOPTS the Workforce Management Plan 2013-2017 as detailed in Attachment 3;
4. Rescinds the Infrastructure Asset Management Policy as adopted on 5 February 2013 – CS06-02/13;
5. Adopts the Asset Management Policy as detailed in Attachment 4;
6. Adopts the Asset Management Strategy as detailed in Attachment 5;
7. Adopts the Summary Asset Management Plan as detailed in Attachment 6; and
8. Adopts the 10-year Long Term Financial Plan 2013/14 – 2022/23 (inclusive of 10-year Capital Works Program) as detailed in Attachment 7.
Attachments:
|
1View. |
Strategic Community Plan |
13/86101 |
Minuted |
|
2View. |
Corporate Business Plan |
13/87275 |
Minuted |
|
3View. |
Workforce Management Plan 2013-2017 |
13/87360 |
Minuted |
|
4View. |
Asset Management Policy |
13/73383 |
Minuted |
|
5View. |
Asset Management Strategy |
13/73378 |
Minuted |
|
6View. |
Summary Asset Management Plan |
13/76426 |
Minuted |
|
7View. |
10 Year Long Term Financial Plan |
13/87808 |
Minuted |
Asset Management Policy
Policy Owner: Infrastructure
Contact Person: Manager Asset Management
Date of Approval:
1. Policy Statement
The purpose of this policy is to guide the strategic management of all City assets in accordance with the Integrated Planning & Reporting Framework (IPRF) strategies, relevant Legislation & Regulations, Australian Standards, Australian Accounting Standards, recognised best practice principles (International Infrastructure Management Manual IIMM) and other City policies.
It will be achieved by
· having an Asset Management Strategy (AMS);
· having a Summary Asset Management plan providing guidance for individual Asset Management Plans for each specific asset class; and,
· ensuring that the AMS and associated systems are kept up to date.
This policy provides an integrated and multidisciplinary environment for undertaking asset management in such a way as to:
1.1 Ensure that assets service the community for current and future generations;
1.2 Ensure that assets provide a level of service and risk the community is willing to support;
1.3 Ensure the sustainable management of assets;
1.4 Encourage and support the economic and social well being of our community; and,
1.5 Allow informed decision making, incorporating whole of lifecycle costing principles.
2. Key Definitions
2.1 Assets
In accordance with the International Infrastructure Management Manual 2011, Infrastructure Assets are ……stationary systems forming a network and serving whole communities where the system as a whole is intended to be maintained indefinitely at a particular level of service potential by the continuing replacement and refurbishment of its components. The network may include normally recognised ordinary assets as its components.
The assets to be considered in this policy include,
· Infrastructure assets such as roads, kerbing, stormwater drainage, pathways, bridges, buildings, playground equipment, public open spaces, sporting facilities, reserves;
· Fleet, plant and equipment;
· Information Technology such as computer hand ware and software; and
· Museum artefacts and art collections.
2.2 Asset Management
The combination of management, financial, economic, engineering and other practices applied to assets from their planning, acquisition, operation, maintenance, replacement and disposal, to ensure that the assets meet the priorities of the Strategic Community Plan with the objective of providing the required level of service in the most cost-effective manner.
3. Objective
The key objective of this policy is to ensure that there is organisation-wide commitment to asset management and that the objectives of the City's AMS are achieved. This will ensure financial data on asset renewals, maintenance of existing assets and new assets are identified and form part of City’s Long Term Financial Plan.
The principal objective of asset management is to enable the City to meet its service delivery objectives efficiently and effectively and through this policy aim to achieve the following:
3.1 Support the City’s vision and strategic objectives through a dynamic framework that will enable asset management to be undertaken in a structured and integrated manner with consideration to full lifecycle costing and assessment of the feasibility and cost of future replacement.
3.2 Provide an essential framework and rationale for recognised best practice asset management decision-making and compliance with relevant Australian Accounting Standards, relevant Legislation & Regulations, Australian Standards, recognised best practice principles (International Infrastructure Management Manual) and other City policies and informing the organisation on how it will maintain its assets to meet service delivery requirements.
3.3 Complement and build on the City’s Strategic Community Plan, and provides a more formalised approach to asset management principles and methodology and integration with the IPRF Framework.
3.4 Provide the framework for the preparation of an Asset Management Strategy and Plans for all assets classes.
3.5 This policy also outlines the importance of asset management and what needs to be considered to ensure:
3.5.1 Financial, social and environmental sustainability issues are clearly understood and recognised by Council (ie: the Elected Members) and the community while providing for present needs and sustaining resources for future generations.
3.5.2 A whole of life approach is incorporated into asset management processes, enabling informed decision-making to meet service needs over the life of an asset from planning, acquisition, operation, maintenance, renewal, investment through to disposal and incorporation into the long term financial plan.
3.5.3 Level of service needs form the basis of asset management with asset performance being measured against levels of service defined in the Asset Management Plans.
3.5.4 Management of assets is undertaken in a structured and integrated way. When assessing the renewal of an asset, upgrades are to be considered to actively reduce the environmental footprint of the asset and increase the opportunities for the use that the asset provides.
3.5.5 Corporate responsibility and resources are identified and established for assets inventory, condition, use and performance.
3.5.6 Risk management is considered as part of asset management planning.
3.5.7 Legislative and regulatory requirements are achieved including maintenance of an accurate asset register in accordance with the requirements of the appropriate accounting standards to enable accurate reporting and effective decision making.
3.5.8 New innovative ways of meeting level of service requirements are sought through continuous improvement.
4. Details
The IPRF requires all local governments to plan for the future including consideration of how the City will continue to deliver services to the community on a long-term basis in a financially sustainable and efficient manner. A strong focus on long-term strategic asset and financial planning is important because there is:
· increasing demand for services as the population grows and changes;
· increasing community expectation in relation to service provision, accountability and value for money;
· a limited ability to grow revenue/finite resources; and,
· the need to maintain, renew or replace infrastructure which is unable to meet future demand.
This Asset Management Policy has been prepared to provide a foundation for the Asset Management Strategy and related Asset Management Plans for individual asset classes. This Policy, Asset Management Strategy and Asset Management Plans make up the Strategic Asset Management Plan Resourcing Framework in the City’s IPRF as depicted in Figure 1 below.
Figure 1: Asset Management and the Integrated Planning and Reporting Framework


4.1 Custodianship
As custodians of the City’s assets, Council is required to represent the community as the asset owner to ensure that assets and services are maintained for present and future generations at an equitable cost.
4.2 Technical and Professional
Administration has a responsibility to provide technical and professional advice to Council so that it is in the position to make the best decisions on behalf of the community.
4.3 Consideration by City
The City will, as part of its consideration of asset management:
4.3.1 Involve and consult with the community and key stakeholders on determining service standards when developing level of service for each asset function;
4.3.2 Act as custodians of assets on behalf of the community and as part of providing quality infrastructure and community facilities, undertake to develop industry standard, affordable and financially sustainable Asset Management Plans that include defined levels of service for each asset function;
4.3.3 Integrate the Asset Management Strategy and Asset Management Plans with the City’s Strategic Community Plan and associated Long Term Financial Plan to provide quality assets that support services that are appropriate, accessible, responsive and sustainable in accordance with the defined needs of the community;
4.3.4 Manage assets in a systematic and sustainable manner;
4.3.5 Ensure asset information is accurate and up-to-date, allowing for appropriate planning, both in the short and long term, and for informed decision making to occur including monitoring asset utilisation and prediction of future demand changes;
4.3.6 Manage its assets utilising a team approach through multi-discipline cross-function asset teams such as:-
· Infrastructure Asset Management Steering Committee (IAMSC);
· Information Technology (IT) Steering Committee;
· Fleet Management Steering Group; and,
· Property Services.
4.3.7 Allocate appropriate resources to ensure asset management practices are undertaken effectively, including timely maintenance and renewal to ensure that lifecycle costs are optimised for both existing and new infrastructure assets;
4.3.8 Prior to the consideration of any major works/renewal or improvement to an asset, undertake a critical review of the need and whole of life cost of that asset, including capital, maintenance, operating, renewal, refurbishment, upgrade and disposal costs;
4.3.9 Utilise the ‘Renew before New’ concept for the development of the draft Ten Year Capital Works Program;
4.3.10 Consider the outputs of the Annual Asset Renewal Demand Modelling analysis undertaken for assets in the development of the Ten Year Capital Works Program and Strategic Financial Management Plan;
4.3.11 Continually seek opportunities for multiple and flexible use of assets where appropriate;
4.3.12 Ensure that the roles and responsibilities for all assets are well defined, understood and assigned appropriately;
4.3.13 Develop and implement a framework for the evaluation and prioritisation of asset related projects based on demonstrated need for the assets;
4.3.14 Develop and apply consistent construction and maintenance standards to assets built by the City and through the Community and/or the Land Developer; and,
4.3.15 Identify, through risk management and condition assessment, initiatives to reduce the exposure to injury, liability and asset failure.
5. Policy Application
This policy applies to Council, Executive Management, staff, Committees of Management, the community and land developers involved in development of new assets and the operation, maintenance, refurbishment, renewal, upgrading and disposal of existing assets.
6. Roles and Responsibilities
Responsibility for asset service delivery and asset management, including accountability and reporting requirements of day-to-day operations, needs to be clearly established and clearly communicated. This will ensure that Council and the City's staff are clearly aware of their responsibilities and roles in relation to asset management.
To manage assets effectively, responsibility for their control must be defined and assigned. Asset registers are to be kept up-to-date and provide timely and meaningful information that meets council and management decision-making requirements.
6.1 Council
6.1.1 To provide stewardship and act as custodians for infrastructure assets;
6.1.2 To set corporate Asset Management Policy with linkages to the City’s Strategic Community Plan and Long Term Financial Plan;
6.1.3 To determine levels of service risk and cost standards associated with assets;
6.1.4 To approve and review the Asset Management Strategy and the Summary Asset Management Plan and monitor the outcomes;
6.1.5 To ensure appropriate resources and funding for asset management activities are made available to integrate Asset Management Policies, Strategies and Plans into the Corporate Governance framework;
6.1.6 To provide consistent and transparent decision making processes based on adopted criteria; and,
6.1.7 To provide an advocacy role with State and Federal Governments and the community.
6.2 Chief Executive Officer and the Senior Management Team
6.2.1 To continually promote asset management across the organisation, and with Council and the community;
6.2.2 To validate and challenge proposals to ensure they meet the City’s Strategic Community Plan objectives and community service needs;
6.2.3 Ensure integration and compliance with the Asset Management Policy and Strategy with other policies and business processes of the City.
6.2.4 To foster and support a multi-discipline, cross-functional responsibility for asset management;
6.2.5 To monitor the performance of staff in implementing asset management;
6.2.6 To ensure community and key stakeholders inputs are integrated into Asset Management Plans; and
6.2.7 To provide effective communication between staff, Council and the community.
6.3 Asset Owners
6.3.1 To develop, implement and review Asset Management Plans based on sound business principles;
6.3.2 To continually seek innovative ways of meeting service needs and deliver enhanced services and organisational performance by optimising and rationalising assets in order to provide the best possible quality and value for money ;
6.3.3 To ensure staff are appropriately trained and skilled to perform the required asset management functions and keep up to date on best practice relating to asset management;
6.3.4 To ensure that accurate and reliable asset information is presented to the Council for informed decision-making; and,
6.3.5 To undertake regular reviews of the Asset Management Policy;
6.3.6 To champion the development, implementation and review of the Asset Management Strategy;
6.3.7 To develop AMP's, using the International Infrastructure Asset Management Manual as a guide, documenting required allocation of funding and improvement plans for individual infrastructure asset groups, using the principles of lifecycle analysis;
6.3.8 In consultation with the community and key stakeholders, identify levels of service for Council’s consideration/approval;
6.3.9 In accordance with the approved Council level of service, deliver those services to agreed risk and cost standards;
6.3.10 To ensure the efficient and effective use of funds as approved by Council and the optimisation of life cycle cost of all assets;
6.3.11 To provide effective communication between staff and the EMT;
6.3.12 To develop and implement maintenance, conservation, preservation, refurbishment and capital expansion, capital upgrade and refurbishment/renewal programs in accordance with AMP's;
6.3.13 To develop and implement procedures that ensure the asset databases are maintained and updated and provide required reports to Council to meet their statutory and legal responsibilities;
6.3.14 To promote and raise awareness of AM to Council, staff, users and community; and,
6.3.15 To measure and report on asset performance including utilisation and costing to ensure that the costs incurred do not outweigh the benefits derived and balance expenditure requirements with the funding ability of the City with reference to the capacity or otherwise of ratings income.
6.3.16 Engage up to date technologies, methodologies and continuous improvement processes
6.3.17 To ensure that assets are universally accessible in accordance with the City's Disability Access and Inclusion Plan.
7. Implementation and Review
Review of this Policy shall take place according to the adopted Policy and Procedure Framework or as determined by Council.
Responsibility for Implementation
Director Infrastructure
|
Versions |
Next Review |
Record No: |
|
4 July 2006 |
|
516924 |
|
4 May 2010 - IN01-05/10 |
March 2012 |
TRIM: 10/1009 |
|
5 February 2013 – CS06-02/13 |
December 2015 |
TRIM: 12/154740 |
|
28 May 2013 |
|
TRIM: 13/73383 |
Asset Management
Strategy
DISTRIBUTION SCHEDULE
|
Revision No. |
Date |
Distribution |
Reference |
|
R1.0 |
|
|
TRIM 13/73378 |
|
|
|
|
|
|
|
|
|
|
|
|
|
|
|
|
|
|
|
|
|
|
|
|
|
|
|
|
|
|
|
|
|
|
|
|
|
|
|
|
|
|
|
|
|
|
|
|
|
|
TABLE OF CONTENTS
2 Introduction
3 Department of Local Government Asset Performance Standard Requirements
4 Strategic Asset Management Plan
4.1 Overview
4.2 Asset Management Policy
4.3 Asset Management Strategy (this document)
4.4 The Summary AM Plan and Detailed AM Plans
5 Asset Management Strategy & Framework
5.1 Purpose of the Strategy
5.2 Scope of the Strategy
5.3 Focus of the Strategy
5.4 Strategic Objectives and Outcomes
1) 5.4.1.............................................................. Direction, Accountability and Integration
2) 5.4.2........................................................................................ Lifecycle Management
3) 5.4.3...................................................................... Data and Information Management
4) 5.4.4......................................................................... Standards and Levels of Service
5) 5.4.5.................................................... Skills, Processes and Continuing Improvement
6 Asset Management Strategy Objectives
6.1 Direction, Accountability and Integration
6) 6.1.1............................................ Strategy for Direction Accountability and Integration
6.2 Lifecycle Management
7) 6.2.1.................................................................... Summary of the Current Asset Base
8) 6.2.2...................................... Corporate Business Plan (CBP) - Asset Related Projects
9) 6.2.3................................................................................................ Financial Context
10) 6.2.4........................................... Estimated Asset Replacement Costs By Asset Class
11) 6.2.5......................... Proposed Renewal Expenditure and Asset Renewal Performance
12) 6.2.6..................................................................... Strategy for Lifecycle Management
6.3 Data and Information Management
13) 6.3.1................................................... Strategy for Data and Information Management
6.4 Standards and Levels of Service
14) 6.4.1....................................................... Strategy of Standards and Levels of Service
6.5 Skills, Processes and Continuous Improvement
15) 6.5.1....................................................................................... The IPRF Requirements
16) 6.5.2............................................................... Asset Management Competency Levels
17) 6.5.3................................ Strategy for Skills, Processes and Continuous Improvement
7 Glossary of Terms
7.1 Definitions
7.2 Abbreviations
APPENDIX A : The Asset Responsibility Matrix
APPENDIX B : The Asset Management Cycle (Process)
1 Executive Summary
Local Governments are asset-intensive organisations, in particular infrastructure assets such as roads. The estimated replacement cost of the City infrastructure assets is approaching $1.2 billion. This exposes the City to considerable risk, not only financial but also political, physical, operational and legal.
The current growth of the City and demand for services, together with its longer-term development, has significant and far-reaching implications for the City's infrastructure and physical asset base. Coupled with this, the State Government enacted legislation in August 2011 introduced the Integrated Planning and Reporting Framework (IPRF). This framework requires all local governments to adopt a long-term future planning and reporting regime that includes giving consideration to how services will continue to be delivered to the community in a financial and sustainable manner.
This is the City's first Asset Management Strategy under the IPRF. It is part of the City's Strategic Asset Management Resourcing Framework that comprises the following documents:
· Asset Management Policy (AM Policy)
This provides the overarching asset management policy and the key principles against which assets are to be managed.
· Asset Management Strategy (AM Strategy)
The Strategy sets asset management objectives, practices and strategies for the improvement of the asset base and the asset management system.
· Summary Asset Management Plan and Detailed Asset Management Plans
These translate the asset management strategies into programs for implementation.
The scope of this strategy relates to the physical assets of the City such as infrastructure, buildings, plant and equipment, and information and communications technology (ICT). It focuses on providing the basis for the development of future AM Plans that ensure the full integration of asset management into the City's corporate planning process and the continuing and future provision of services to the community to the right standard, at the right time and place, and at the right cost.
These are complex challenges, not least of which will be how to balance investment in new assets with the need to maintain the efficient and effective provision of community services from the existing asset base.
In considering this, the City's vision is for a portfolio of high-performing and sustainable assets that are managed to international standards of practice; that strive to meet the priorities and aspirations of the community and the strategic and operational needs of the City and are balanced within the City's financial context.
Against this background, the strategy sets asset management objectives and outcomes that are consistent with the City's Asset Management Policy, meet the requirements of the IPRF, and define a road map for the development of the City's asset management capacity and capability necessary to meet the challenges of the future. It also identifies how these objectives and outcomes will be achieved.
The City has developed the following strategic objectives for the AM Strategy:
· Direction, Accountability and Integration
To develop a Whole-of-City asset management system and process that provides direction across the organisation, promotes clear accountability at all levels of management and integrates asset management into the corporate planning process.
· Lifecycle Management
To manage the City's assets on the principles of lifecycle management to ensure their most effective and efficient performance.
· Data and Information Management
To ensure the quality and accuracy of asset data and information that enables analysis of asset performance and effective decision-making.
· Standards and Levels of Service
To develop asset management standards and levels of service that reflect community aspirations and satisfies the internal requirements of the City's business units.
· Continuous Improvement
To develop an organisation-wide asset management function with a culture of continuous improvement in skills, processes, knowledge and practices.
2 Introduction
In October 2010, the Department of Local Government released the Integrated Planning and Reporting Framework (IPRF), which became law in August 2011. The IPRF consists of a Strategic Community Plan (SCP) and a Corporate Business Plan (CBP) that is informed by various strategies, including Long Term Financial Planning (LTFP), Workforce Planning (WP), and Asset Management (AM).
The IPRF requires all local governments to plan for the future including consideration of how they will continue to deliver services to the community on a long‑term basis in a financially sustainable and efficient manner.
Assets are fundamental to Councils’ overall service delivery and planning. Responsibility for assets requires strong and informed Council and executive oversight to achieve and maintain sustainable asset management outcomes.
Asset management must form part of an effective integrated planning and reporting framework, linking with, and supporting long-term financial planning and strategic planning to ensure that the appropriate level of funds and resources are available to continue to provide services to the community in accordance with Council’s objectives as set out in the Strategic Community Plan (SCP).
A strong focus on long-term asset planning is important because there is:
· Increasing demand for services as the population grows and changes;
· Increasing community expectations in relation to service provision, accountability and value for money;
· Limited ability to grow revenue and finite resources; and,
· A need to maintain, renew or replace assets.
The City has responded to the IPRF with the development of a Draft 10 year Strategic Community Plan (2013/14 to 2022/23) which represents the Community's Long Term aspirations inclusive of a 4 year Corporate Business Plan and a one year Operational Plan.
These plans are supported by a Resourcing Framework that outlines the City's capacity to deliver services and manage its assets over the next 10 years. The Resourcing Framework contains the following four plans:
· Long Term Financial Plan;
· Strategic Asset Management Plan incorporating:
- Asset Management Policy (AM Policy);
- Asset Management Strategy (AM Strategy, this document); and,
- Summary AM Plan and Detailed AM Plans.
· Workforce Management Plan; and,
· Information and Communication Technology Strategic Plan.
Figure 1 below shows how the City's various plans relate to each other under the new IPRF and where the components of the Strategic Asset Management Plan fit into this structure.
 |
Figure 1: Asset Management and the Integrated Planning and Reporting Framework
3 Department of Local Government Asset Performance Standard Requirements
All local governments in Western Australia are required to demonstrate compliance with the Department of Local Government’s Advisory Standards (Basic Standard) for each level of planning under the IPRF.
They are required to achieve, by July 2013, a base standard for the Asset Management Framework which encompasses the following:
· Development of an AM Policy;
· Development of an AM Strategy including:
- AM Plans that considers major asset classes;
- Processes that link AM Plans to Long Term Financial Plans;
- Defined levels of service and affordability;
- Governance and management arrangements;
- Data and systems to support asset management; and,
- Improvement of skills and processes.
· Development of a process for evaluating AM Plans, processes and asset sustainability;
· Linking of asset management to the Annual Report.
These standards are designed to encourage continuous improvement along the asset management continuum.
The basic standard for asset management in the IPRF is:
· The existence of Asset Management Plans for significant and critical asset classes; and,
· Key Performance Indicators (KPIs) that meet these standards. These KPIs are summarised in Table 1.
Table 1: Key Department of Local Government Performance Standards for Asset Management
Key Performance Indicator |
Measure |
Basic Standard |
Advanced Standard |
|
Asset Consumption Ratio (Aged condition of asset stock) |
Written Down Asset Value Divided by Current Replacement Costs |
Ratio can be identified; and ratio is ≥ 50% |
Ratio between 60% and 75% |
|
Asset Sustainability Ratio (Extent of asset replacement at end of useful life) |
Capex on Asset Replacement/Renewal Divided by Depreciation Expense |
Ratio data can be calculated; and ratio is ≥ 90% |
Ratio between 90% and 110% |
|
Asset Renewal Funding Ratio (Capacity to fund asset renewal without increasing current operating liabilities) |
NPV of Planned 10-year Capex on Renewals Divided by NPV of Required 10-year Capex on Renewals |
Ratio data can be identified; and ratio is between 75% and 95% |
Ratio between 95% and 105%; and ASR is within 90% and 110%; and ACR is within 50% and 75% |
Estimations of the City's ratios are contained in section 6.2.5
4 Strategic Asset Management Plan
4.1 Overview
The City's Strategic Asset Management Plan is a sub-set of Council's Resourcing Framework encompassing (as depicted in Figure 1):
· AM Policy;
· AM Strategy;
· Summary AM Plan and Detailed AM Plans.
Asset Management is a task of managing non-current assets for the lowest lifecycle cost. It is a multi-disciplinary task combining key areas of expertise in:
· Management;
· Planning;
· Finance;
· Economics;
· Property;
· Engineering; and
· Maintenance.
One of the biggest challenges facing the City is how it will sustainably balance the timely provision of new facilities for our rapidly growing areas as well as ensuring that the existing portfolio of assets, particularly long life assets like infrastructure assets, are maintained, refurbished and/or upgraded to suitable standards that are acceptable to the community.
The cost of maintaining, upgrading and renewing infrastructure assets represents a large component of the City's Operating and Capital Works Budget. The City needs to ensure that its assets are managed efficiently to demonstrate value for money but also to reduce their impact on the environment.
The City has care, control and responsibility of a diverse and extensive portfolio of assets which are used to deliver services to the community. Assets have been accumulated over a number of years and have either been purchased, constructed or gifted from other tiers of government, private developers or the community.
Assets are often built or acquired in waves that align with economic need or prosperity. All these assets require maintenance, refurbishment and renewal activities throughout their lifecycle. If the Council intends to continue its services through these assets, it will need to adequately budget for these activities in its annual budgets and long term financial plan.
The most cost effective way to do this is to maintain or renew assets at the optimum time. Renewing assets too early wastes life in the asset, whereas renewing assets too late increases risk and consequently increases costs. The challenge for the City is to choose the optimum time for the maintenance and renewal of its assets and ensure sufficient funds and resources are available to undertake these activities. For this to happen, the City needs to understand its assets and be able to estimate the optimum replacement cycle and then put in place strategies to ensure funds and resources are available when required.
At the most basic level, the following need to be in place to achieve the above outcomes:
· Know what assets are owned or controlled by the City;
· Know their condition;
· Understand the expected life of the assets;
· Understand what assets are required to underpin current and future service needs;
· Decide what future asset needs mean in terms of acquisitions, maintenance and disposals;
· Know the cost to provide the service and managing assets;
· Have a system in place to prioritise resource allocation that it is aligned with the Strategic Community Plan and Corporate Business Plan;
· Have all of the above summarised in an AM Plan; and,
· Ensure that all costs (and revenues) are captured in the financial management system and entered into the Long Term Financial Plan.
|
Current Position The City has much of the above practises in place for infrastructure assets. Formalising the relevant documents and documenting the associated processes and procedures will be the focus of improvements to ensure compliance. Also this practise will also need to be applied to other assets such as Fleet, Plant & Equipment and IT assets. |
4.2 Asset Management Policy
The adoption of an AM Policy will ensure that there is organisation-wide commitment to asset management and outlines the framework and objectives that enables the development of the AM Strategy and AM Plans.
|
Current Position Council previously adopted an Infrastructure AM Policy. This Policy has been reviewed to incorporate the requirements of the IPRF and also to include other assets such as Fleet, Plant & Equipment and IT assets. |
4.3 Asset Management Strategy (this document)
The AMS is the asset response to service needs and drives the entire asset management process. It is a high-level corporate management document that ensures the objectives of the AM Policy is implemented, and provides the management framework to enable the implementation of detailed AM Plans.
|
Current Position This AM Strategy document has been prepared as part of IPRF requirements. |
4.4 The Summary AM Plan and Detailed AM Plans
The Summary AM Plan will bring together the corporate requirements of the various detailed AM plans and improvement planning summaries. The Summary AM Plan and detailed AM Plans:
· Demonstrate how the City will manage its assets and ensure service delivery continues in line with the aspirations of the SCP and CBP.
· Contain the basic tools to enable Council to make informed decisions on the allocation of resources in order to maintain all major assets to the standard required to satisfy service delivery needs.
· Will ultimately provide guidance on the long-term (10 years) allocation of financial and physical resources required to ensure the continuing operational performance of the City assets.
· Set out how the council delivers service to the community on a long-term sustainable basis and the assets required to underpin service delivery.
· Capture and document corporate knowledge about assets and the required service levels to support service delivery.
|
Current Position The City has adopted AM Plans for most of the City's infrastructure assets such as Roads & Pathways, Stormwater Drainage and Buildings. The review of these AM Plans are currently in progress including the development of the Parks AM Plan and Natural Area AM Plan. AM Plans for Fleet, Plant & Equipment and IT are still to be developed. |
5 Asset Management Strategy & Framework
Council is the custodian of a significant portfolio of assets and through its AM Policy, AM Strategy and AM Plans, it will be able to make better informed decisions on behalf of the community. The City recognises that it will not always be able to meet all of the community's expectations and sometimes difficult choices will need to be made but these decisions will be made in the best interest of the community as a whole.
5.1 Purpose of the Strategy
The purpose of this AMS is :
· To set objectives and outcomes and ensure that the management of its assets is consistent with the AM Policy and meets the minimum requirements of the IPRF; and
· To outline a road map for the development and improvement of its asset management capacity in relation to the current and future service requirements whereby the City will achieve benefits in terms of:
Meeting legislative requirements;
Better quality data for decision-making;
Reduced risk of asset failures and improved risk management;
Better long-term financial management and planning;
Minimised lifecycle costs and improved sustainability; and,
Auditable decision making and reporting.
5.2 Scope of the Strategy
The assets considered in this strategy include the following asset classes:
Table 2: Asset Classes considered in this AM Strategy
|
Asset Class |
Assets included in the Asset Class |
|
Land |
Vacant and developed freehold land. |
|
Transport Assets |
Roads, Carparks, Pathways, Kerbs, Bridges, Bus Shelters, Roadside Furniture, Signage, Street Lighting.
|
|
Building Assets |
Libraries, Public Halls, Multi-Purpose Community Facilities, Public Toilets, Houses, Museums, Council Offices, Leisure Centres, Amenity Buildings, Furniture. |
|
Stormwater Drainage Assets |
Drains, Pipes, Culverts, Pits, Gross Pollutant Traps, Wetlands. |
|
Park Assets |
Parks, Gardens, Sports Ovals, Play Equipment, Irrigation Systems, Skate Parks, Tennis Courts, Golf Course, Park Furniture, Sports Field Lighting. |
|
Natural Areas and associated assets |
Conservation and foreshore fencing, signage, beach access ways and limestone tracks. |
|
Plant and Equipment |
Motor Vehicles, Trucks, Construction Equipment, Gardening Equipment. |
|
ICT |
Computer Systems & Equipment. |
|
Art Collections |
Museum Artefacts and Art Collections |
5.3 Focus of the Strategy
This AMS focuses on developing and improving existing internal capacity and processes to enable the implementation of the AM Policy objectives. It also formally integrates asset management into the corporate and business planning regime by informing and being informed by the Strategic Community Plan, Corporate Business Plan and Long Term Financial Plan.
The key focus areas for this AMS are therefore to:
· Develop asset management knowledge and capacity;
· Understanding the current asset base;
· Shape the asset requirements for the future; and,
· Integrate asset management into the corporate planning process.
5.4 Strategic Objectives and Outcomes
In keeping with the focus areas, the following strategic objectives have been identified for achieving best practise asset management outcomes (Table 3 lists these objectives with their desired outcomes and Section 6 provides further details) :
5.4.1 Direction, Accountability and Integration
To develop an asset management framework and process that provides direction across the organisation, promote clear accountability at all levels of management, and integrate asset management into the corporate planning process.
5.4.2 Lifecycle Management
To manage the City’s assets on the principles of lifecycle management to ensure their most effective and efficient performance.
5.4.3 Data and Information Management
To ensure the quality and accuracy of asset data and information that enables analysis of asset performance and effective decision-making.
5.4.4 Standards and Levels of Service
To develop asset management standards and levels of service that reflect the aspirations of the community and satisfies the internal requirements of the City's service units.
5.4.5 Skills, Processes and Continuing Improvement
To develop an organisation-wide asset management function with a culture of continuing improvement in skills, processes, knowledge and practices.
Table 3: Strategic Objectives and Outcomes
|
Strategic Objective |
Desired Outcome |
|
Direction and Accountability |
Defined roles and responsibilities and accountabilities that are clearly understood across the organisation and integrated into the City business and resources planning process. |
|
Lifecycle Management |
A portfolio of assets that is aligned with the City corporate, financial and business objectives, which is effectively and efficiently managed from asset conception, planning, design, use and disposal. |
|
Data and Information Management |
The ability to identify, analyse and model asset trends that enhance asset efficiency and effectiveness and enable informed decision-making. |
|
Standards and Levels of Service |
A portfolio of assets that is aligned with community and organisational expectations and priorities having regard to the financial context of the City. |
|
Skills, Processes and Continuing Improvement |
Ongoing improvement in asset management competency and capacity. |
6 Asset Management Strategy Objectives
6.1 Direction, Accountability and Integration
Asset management is a core part of the City’s operations and overall long-term sustainability that requires clear guidance and leadership from across the organisation.
As a first step in the governance and management of the City’s asset management process and the management of the asset base itself, the following has been identified as asset management tasks that need to be assigned within an asset management governance and management framework:
· Development of a matrix setting out responsible officers for each task over the entire asset management lifecycle for each major asset group or asset ownership portfolios (refer to Appendix A: Asset Responsibility Matrix);
· Representation from across the organisation to ensure that asset management supports the required service delivery;
· Ensuring that management practices are applied consistently across the organisation and supported by a continuous improvement plan;
· Ensuring an ongoing organisational commitment to asset management and that it is adequately resourced;
· Developing an asset hierarchy including common asset numbers and linkages across asset registers;
· Ensuring that data and systems are in place to support improvements in asset management practices.
· Ensuring asset inventory information is up-to-date and regularly reviewed;
· Ensuring asset condition assessments are regularly undertaken and associated reports are maintained;
· Ensuring the chart of accounts structure and system is sufficiently componentised to allow the reporting of operating, maintenance, renewal, upgrade and new expenditure at the appropriate component levels and by asset hierarchy in the Finance and Asset Management Systems;
· Applying Risk Assessment tools to support decision making;
· Annual review and update of the AM Strategy and AM Plans;
· Annually revise the asset renewal demand projections in the Summary AM Plan and Detailed AM Plans.
· Updating the renewal model and ensure that the LTFP is updated;
· Monitoring and evaluation of asset management performance, including reporting to the Executive Management Team;
· Annually revise the roles & responsibilities matrix and update a skills assessment gap in order to refine the ongoing training program for Officers and Elected Members;
· Analysis of the realistic useful life of assets in order to refine the renewal demand model;
· Ensure assets are reflected at fair value so that realistic Asset Sustainability indicators can be developed;
· Develop and document a formal process for the handover of new assets to asset owners, which ensure any impacts on 'Business As Usual' are taken into account;
· Improvement of skills and processes relating to asset management;
· Manage, monitor, review and report upon the implementation of the AM Plans;
· Develop strategies for communications with asset owners, ICT, Finance, the Executive Management Team and other stakeholders.
· Integration of asset management into the corporate planning, business and reporting process.
6.1.1 Strategy for Direction Accountability and Integration
The roles, responsibilities and associated accountabilities adopted in the City’s AM Policy for the management of assets are shown in Table 4.
The actions and status of this strategic objective is summarised in Table 5.
Table 4: Asset Management Roles and Responsibilities
|
Entity |
Role |
Responsibility & Accountability |
|
Council (Elected Members)
|
Strategy |
· To provide stewardship for infrastructure assets. · To set levels of service, risk and cost within available resources. · To approve and review AM Policy, AM Strategy and Summary AM Plan; and monitor the outcomes. · Ensure appropriate allocation of AM resources/funding. · To provide consistent and transparent decision making processes based on adopted criteria. · To provide an advocacy role with State and Federal Governments and the community. |
|
Chief Executive Officer and Senior Management Team |
Corporate/ Organisational Objectives &
Translation of Objectives & Plans into Business Plans/Service Strategies Planning |
· To Implement the AM Policy. · To continually promote asset management across the organisation, and with Council and the community. · To validate and challenge proposals to ensure they meet the City’s Strategic Community Plan objectives and community service needs. · To ensure the integration and compliance with the AM Policy, AM Strategy, other policies and business processes of the City. · To foster and support a multi-discipline, cross-functional responsibility for asset management. · To ensure community and key stakeholders inputs are integrated into AM Plans. |
|
Asset Owners |
Strategy Implementation
Service Provision |
· To undertake regular reviews of the AM Policy. · To champion the development, implementation and review of the AM Strategy and AM Plans for individual asset groups. · To continually seek innovative ways of meeting service needs and deliver enhanced services and organisational performance. · To ensure the efficient and effective use of funds as approved by Council and optimising life cycle cost of all assets. · To promote and raise the awareness of AM to Council, EMT, staff, users and community. · To measure and report on asset performance, utilisation and costing. · To implement improvement plans for asset group. |
Table 5: Direction and Accountability Strategy
|
Strategic Objective: Direction and Accountability |
Defined roles and responsibilities and accountabilities that are clearly understood across the organisation and integrated into business and resources planning process. |
|
Item |
Strategy |
Action Required |
Status |
|
Governance and Management Arrangements |
Development of governance and management arrangements |
Development of roles and responsibilities and assignment of asset management tasks. |
Progressing – need to cover all assets and formalise documentation on roles and responsibility. |
|
Nominated senior corporate sponsor of asset management. |
Complete – CEO responsibility. |
||
|
Nominated owner of the corporate function. |
Complete - Director Infrastructure responsibility. |
||
|
Active involvement of Executive Management Team and asset owners. |
Complete - three asset management working groups are established for consultation; a) Infrastructure Asset Management Steering Committee (IAMSC); b) IT Steering Committee; and c) Fleet Management Steering Group. |
||
|
Elected members are kept informed of asset management progress. |
Progressing – Review of AM Policy, AM Strategy and Summary AM Plan is to be reported to Council. Progress of this AMS will be reported in future. |
6.2 Lifecycle Management
The development of a strategy to align the City assets, which are managed from asset conception, planning, design, use and disposal, with its corporate, financial and business objectives requires an analysis of the City’s existing asset base and the management of assets on the basis of the asset management cycle and associated processes.
6.2.1 Summary of the Current Asset Base
The City’s asset base is comprised of four asset categories. The estimated current replacement cost of these assets and the value of unfunded renewal demand is as shown in Table 6. The current replacement cost has been estimated using current 2012 unit rates. Note that this plan only considers depreciable assets.
Table 6: Summary of the City's current portfolio of major depreciable assets.
|
Asset Class |
Estimated Current Replacement Cost ($) |
Predicted Value of Current Unfunded Renewals (Backlog) ($) |
|
ICT |
Data Not Included |
0 |
|
Infrastructure Assets |
1,166,794,000 |
5,544,000 |
|
Fleet, Plant and equipment |
Data Not Included |
0 |
|
Grand Total |
1,166,794,000 |
5,544,000 |
Notes:
1. Data for ICT, Fleet, Plant & Equipment assets have not been included in the table at this time.
2. Assets considered here are those that depreciate over time. Assets such as Road Formation do not deteriorate as once constructed, do not require future reconstruction. Similarly, Land does not depreciate and therefore has not been included the table.
6.2.2 Corporate Business Plan (CBP) - Asset Related Projects
The CBP outlines a program for a significant number of projects within the Capital Works Program over the next 10 years. The majority of these projects will have implications for asset management.
Integration of these projects into the asset management process is included in the Summary AM Plan and Detailed AM Plans.
6.2.3 Financial Context
Asset expenditure forecasts and ratios will inform the LTFP.
The information and results of the expenditure forecasts, indicators and renewal/replacement gaps provide a baseline from which the City will review its current asset base in the manner described in this strategy. This will enable the City to prioritise and plan asset expenditure to reflect the needs of critical and significant assets in the context of the availability of funds.
All data used in compiling the status of the current asset base has been sourced from asset databases which are a consolidation of analysis of the following:
· 10-Year Capital Works Program.
· Infrastructure Asset registers (Transport, Buildings, Parks and Stormwater Drainage Assets).
· Corporate Property database.
· Roman 2 (Road Asset Management Software).
· Plant and equipment registers.
· ICT asset register.
All calculations are based on current known data and asset replacement values based on 2012 unit rates. This strategy provides for all asset data to be checked and verified, following which the status of the existing asset base will be reviewed and updated.
6.2.4 Estimated Asset Replacement Costs By Asset Class
As the data for Land, Plant & Equipment and ICT assets are not yet available, the figures below only represents infrastructure asset renewal demand.
Table 7 shows the estimated current replacement cost by asset class. Total replacement cost for all infrastructure assets are estimated at $1,166,794,000.
Replacement/Renewal estimates have been derived from the recently developed Asset Databases. This contains a schedule of rates for replacement/renewal of assets.
Table 7: Estimated Asset Replacement Cost - Infrastructure
|
Infrastructure Assets |
Estimated Current Replacement Cost ($) |
Predicted Value of Current Unfunded Renewals (Backlog) ($) |
|
Transport |
677,428,600 |
1,372,650 |
|
Buildings |
218,243,200 |
801,250 |
|
Parks |
90,730,000 |
3,370,100 |
|
Stormwater Drainage |
180,392,300 |
0 |
|
Total Infrastructure Assets |
1,166,794,000 |
5,544,000 |
Notes:
1 The Predicted Value of Unfunded Renewals is an estimate as at 30 June 2013. The 'backlog' reflected in Figure 2 overleaf has been reduced through the level of Renewal expenditure proposed in 2014.
6.2.5 Proposed Renewal Expenditure and Asset Renewal Performance
The data presented here relates to infrastructure asset renewal demand.
6.2.5.1 Renewal Expenditure Results - Infrastructure Assets
The current renewal funding allocation for infrastructure assets in the City’s draft 2013/14 Ten Year Capital Works Program and the resultant estimated asset renewal demand impact and value of unfunded renewal demand (backlog) is as shown in Figure 2.
Figure 2: Predicted Asset Renewal Demand and Unfunded Renewals – Infrastructure Assets Only
Notes:
1. The City's planned renewal expenditure for years 2014 to 2023 is based on the draft 2013/14 Ten Year Long Term Financial Plan.
2. The Predicted Annual Renewal Demand Impact includes the value of unfunded renewal from previous year (backlog).
3. Positive backlog figures represents value of unfunded renewals while negative values represent the value of renewed assets that have yet to reach intervention. It should be noted that this graph represents one strategy to fund renewals.
4. The predicted value of unfunded renewals shown in each year is the total renewal demand inclusive of backlog less renewal funding allocated in that year.
Figure 2 demonstrates that the City is currently managing its renewal demand with the current proposed renewal expenditure at least in the first 8 years. In year 9 and 10, the resultant value of unfunded renewals start to increase. Further asset renewal funding will be required in these years to bring the unfunded renewals to manageable levels.
6.2.5.2 DLG Key Performance Indicators (Asset Ratios) – Infrastructure Assets
The predicted Asset Performance Ratios resulting from the proposed 10 year Capital Renewal Expenditure detailed in the previous section is shown in Figure 3.
Figure 3: Predicted Asset Performance Ratio Indicators – Infrastructure Assets Only
The estimation of the current Asset Ratios specified by the Department of Local Government are shown in the following table.
Table 8: Estimated Asset Ratios
|
Key Performance Indicator |
Measure |
Ratio |
Basic Standard |
|
Asset Consumption Ratio |
Written Down Asset Value (WDV) Divided by Current Replacement Costs |
80% |
Ratio can be identified; and ratio is ≥ 50% |
|
Asset Sustainability Ratio |
Capex on Renewal & Replacement Divided by Depreciation Expense |
43% |
Ratio data can be calculated; and ratio is ≥ 90% |
|
Asset Renewal Funding Ratio |
NPV of Planned 10-year Capex on Renewals Divided by NPV of Required 10-year Capex on Renewals |
75% |
Ratio data can be identified; and ratio is between 75% and 95% |
Based on Figure 3, the performance indicators are within reasonable limits over the next 8 years. High growth within the City of Wanneroo will continue to influence the results of these Asset Performance Ratios. The results of the calculated ratios are further discussed below:-
· Asset Consumption Ratio (ACR)
The ACR highlights the aged condition of physical assets. All local governments will be required to report this ratio utilising current financial records.
The basic standard set by the DLG is a ratio of no less than 50%. The current ACR for the City's Infrastructure Assets is estimated at 80%.
The indicative target is between 40 – 80%. This ratio is relatively high for Wanneroo due to its most valuable assets being relatively new. It is likely to remain high with continuing high growth anticipated and the construction of new infrastructure assets.
· Asset Sustainability Ratio (ASR)
The ASR measures the extent of asset replacement at the end of useful life. The ratio is intended to indicate whether a local government is renewing or replacing existing non-financial assets at the same rate that its overall stock of assets is wearing out. It is calculated by measuring capital expenditure on renewal or replacement of assets relative to the rate of depreciation of assets for the same period.
The basic standard set by the DLG is a ratio of no less than 90%. The current ASR for the City's Infrastructure Assets is estimated at 43%. The DLG's Asset Management Framework and Guidelines publication provides the following explanation in respect to the ASR (page 38):
"If capital expenditure on renewing or replacing assets is at least equal to depreciation on average over time, then the local government is ensuring the value of its existing stock of physical assets is maintained. If capital expenditure on existing assets is less than depreciation then, unless a local government’s overall asset stock is relatively new, it is likely that it is underspending on renewal or replacement. This is likely to result in additional maintenance costs for assets that have exceeded their useful life that exceed the costs of renewal and replacement. This situation could progressively undermine a local government’s financial sustainability as it is confronted with failed assets and significant renewal and replacement costs that cannot be accommodated without sudden large rate increases."
A ratio of 100% indicates that asset stock is being replaced at a sustainable level. It is recognised however that this may be 50% or less when asset portfolios are young. A large percentage of the City's assets are in new to very good condition with approximately 85% of the total asset base at or below condition 2 (a rating of 0 represents a new asset and 10 assets that are failing). Less than 1% of the asset base is at or above condition 8, which represents assets that require immediate attention.
With the City's current mix of old and new assets and continued high growth, the current ASR is at an acceptable level. As the stock ages it should increase but continued growth may keep it relatively low.
· Asset Renewal Funding Ratio (ARFR)
The ARFR measures the capacity to fund asset renewal without increasing operating liabilities.
The basic standard set by the DLG is a ratio of between 75% and 95%. The current ARFR for the City's Infrastructure Assets is estimated at 75%.
The target for sustainable assets is between 95-105%. The indicators predicted in future years suggest that for the latter part of the 10 year capital works program, there is a need to increase renewal funding allocated where the ratio has dipped below the 60% mark.
It must be noted that the ASR and ACR ratios are dependent on calculating the Written Down Value of assets. At this stage the City has yet to revalue its assets based on Fair Value. This is being addressed as part of the improvement plan suggested in this Strategy.
The calculations used here to determine the Written Down Value for infrastructure asset have been based on Depreciated Current Replacement Cost obtained from Asset Management databases.
6.2.6 Strategy for Lifecycle Management
The strategy for Lifecycle Management is outlined in Table 9.
Table 9: Lifecycle Management Strategy
|
Strategic Objective: Lifecycle Management |
A portfolio of assets that is aligned with corporate, financial and business objectives, which is efficiently and effectively managed from asset conception, planning, design, use and disposal. |
|
Item |
Strategy |
Action Required |
Status |
|
Asset Knowledge |
Develop a detailed understanding of the asset portfolio in terms of asset inventory; asset condition, value, cost and appropriateness; and remaining life. |
Carry out a comprehensive asset audit, including land holdings, revenue assets, Fleet, Plant & Equipment and IT assets. |
Progressing |
|
Confirm condition of significant & critical assets. |
Progressing |
||
|
Develop maintenance & renewal programs that align with strategy and asset owner requirements. |
Progressing |
||
|
Goals & Objectives |
Asset Management Strategies and Plans will align the asset portfolio with the strategic goals and objectives of the local government. |
Integrate asset strategies and plans into Asset Strategy and Planning documents that reflect the Strategic Community Plan, Corporate Business Plan, ICT Strategy and Long-term Financial Plan. |
Progressing – asset management framework documents are complete but are yet to be fully integrated into internal business processes.
|
|
Adopt a performance management system based on a balanced scorecard approach, i.e. financial, customer, internal business, and environmental and social perspectives. |
Progressing – performance is assessed on financial basis.
|
||
|
Develop a Performance Management System comprising sets of Performance Objectives, Key Performance Indicators and Measures of Performance for each asset class. The Performance Management System will be drawn up and agreed in consultation with asset owners. |
Progressing – not currently measured. |
||
|
Service Drivers |
Asset Strategies and Plans to address the long, medium and short-term needs of each service demand set. |
Implement an integrated whole-of-organisation strategic and planned approach to asset management. Each directorate will define the criteria required of their assets having regard to the following: · Asset type; · Location; · Utility; · Serviceability and functionality; · Condition; · Amenity; and · Financial criteria. |
Progressing - The current management of assets is principally driven by the requirements of the physical upkeep of assets, the operational requirements and through community surveys. |
|
Asset Management and Financial Reporting |
Consolidate all asset data into a single comprehensive database linked to financial and accounting systems. |
Check, cleanse and verify all asset data across all registers, records and systems. |
Ongoing |
|
Manage the Renewal Gap |
Prioritising and grading the importance of each asset. |
Complete - hierarchy established |
|
|
Identifying significant and mission critical assets. |
Progressing |
||
|
Assessing the continuing need and standards/levels of service for these assets. |
Progressing |
||
|
Defining minimum asset condition and in-use efficiency and effectiveness to support service levels. |
Progressing |
||
|
Assessing their condition. |
Progressing – some assets conditions are assumed based on age. |
||
|
Assessing the risk and impact on the services and operations of any failure to meet standards/levels of service. |
To be addressed |
||
|
Develop individual asset plans for mission critical assets and the balance of asset classes by reference to the financial context and availability of funds. |
Progressing – yet to progress Fleet, land and ICT |
||
|
Asset Management Key Financial Performance Indicators |
Establish a new budgeting and financial reporting regime that reflects the whole-of-life management of assets.
|
Develop new budget processes and financial reporting regimes for each asset type that is based upon their actual operating and service performance requirements as part of individual asset plans. Asset Consumption Ratio: refine the estimation of this ratio as improvements are made to financial & asset data. Asset Sustainability Ratio: confirm a ratio that reflects the true position by: · Examining and confirming asset Written Down Values; · Reviewing the estimated expenditure on asset renewal and replacement; and, · Refining the budget process and methodology. Asset Renewal Funding Ratio: Calculate ratio following finalisation of asset renewal program. |
Requires substantial additional work - This strategy presents initial assessments of asset replacement costs, expenditure forecasts, renewal gaps and ratios. These will inform the LTFP. |
|
Asset Management Cycle & Processes |
Introduce Asset Management processes based on acknowledged leading practice principles for the public sector that cover all stages of asset lifecycles. |
Construct and implement processes for: · Strategic Asset Planning; · Asset Programs; · Asset & Service Delivery Programs; · Performance Management & Review; and, · Develop and monitor processes for Improvement. |
To be addressed |
6.3 Data and Information Management
6.3.1 Strategy for Data and Information Management
The strategy for data and information management is contained in Table 10.
Table 10: Data and Information Management Strategy
|
Strategic Objective: Data and Information Management |
The ability to identify, analyse and model asset trends that enhance asset efficiency and effectiveness and enable informed decision-making. |
|
Item |
Strategy |
Action Required |
Status |
|
Data Systems |
Consolidate asset management data and information onto a single AM System that satisfies the following criteria: · Linkage to the Financial system; · Categorisation of asset classes and hierarchies; · Capacity to store and record all asset details; · Maintenance planning and management; · Works management; · Procurement and contract management; · Develop management and work processes; · Basic reporting functions; · Capacity for development to meet the expanding data and information management needs; · Compatible with web-based devices to transfer data between operational sites and the AM System; · Local government experience; · Strong systems support. Convert to an AM System within 12 months. |
Define required asset data and asset information requirements. Define asset management information reporting hierarchy and requirements that are consistent with governance and management arrangements. Collate data onto individual spreadsheets for transfer into an AM System Develop specification for an AM System. Select and implement an AM System. Develop processes and procedures. |
Currently working with Civica to implement asset management module. |
6.4 Standards and Levels of Service
6.4.1 Strategy of Standards and Levels of Service
Strategies are contained in Table 11.
Table 11: Standards and Levels of Service Strategy
|
Strategic Objective: Standards and Levels of Service |
A portfolio of assets that is aligned with community and organisational expectations and priorities having regard to the financial context of the local government. |
|
Item |
Strategy |
Action Required |
Status |
|
Levels of Service (LOS) & Property/Facility Management Standards |
Expand/enhance the community surveys to include information relating to the condition, use and effectiveness of assets. Document a LOS framework that clearly defines and documents LOS for: · Community; · Technical; · Compliance; and · Internal services.
|
Design survey template for community feedback on assets; and methodology to interpret and analyse responses for input into strategies. |
To be addressed
|
|
Agree and set minimum internal and external standards for each asset category/facility supported by an inspection and management regime. |
Progressing |
||
|
Document a register of legislative compliance requirements, codes of practice and standards, and other relevant obligations; and develop processes to ensure their compliance. |
Progressing |
||
|
Performance Measurement |
Develop a performance measurement system that comprises performance outcomes, performance standards and targets, performance indicators and measures, and bases of measurement and benchmarks. |
Develop methodologies to measure and analyse the performance of assets, and the asset management systems and processes used in their management, against LOS and financial criteria. |
To be addressed |
6.5 Skills, Processes and Continuous Improvement
6.5.1 The IPRF Requirements
The IPRF notes that asset management is a journey where the initial stage is achieving core competency, and ongoing development reaches an advanced level of competency or maturity.
The Department of Local Government acknowledges that the preparation of an AM Strategy and Plan is an iterative process, which may take several years to refine into mature documents that meet a core level of maturity.
The various levels of Asset management Practices are defined below:
Minimum (M): The absolute basic level of asset management. Data is presented in top-down models.
Core (C): Asset Management which relies primarily on the use of an asset register, maintenance management systems, top down condition assessment, simple risk assessment and defined levels of service, in order to establish a long-term cash flow projection.
Intermediate (I): Those asset groups that may be defined as Intermediate are either undergoing the process of moving from Core to Advanced status or would benefit by having more that a core level of Asset Management Practice but does not require advanced Asset Management Practice.
Advanced (A): Asset Management which employs predictive modelling, risk management and optimised decision making techniques to establish asset lifecycle treatment options and related long term cash flow predictions.
The City needs to understand the nature of the gap between the current AM practices and the desired AM practices for each of its Asset Classes and Asset Types. The understanding of this gap will drive the City's improvement process and the identification of a timeline of critical tasks required to close the gap.
Not all Asset Types will have the same appropriate asset management practices. The level of AM practice will in most instances be based on the level of risk exposure and consequences of failure. The higher the risk associated with failure, the higher level of AM practice is required.
The City of Wanneroo’s objective is to attain an ‘Intermediate’ standard over a period of five years. The Summary AM Plan sets out a program of work to achieve this objective.
6.5.2 Asset Management Competency Levels
Table 12 provides definitions for Core and Advanced levels for each element of asset management. These definitions are based on the Institute of Asset Management Manual, and will be used as measures of continuous performance progress.
Table 12: Asset Management Competency Levels
|
AM Activity |
Core |
Advanced |
|
Governance |
· AM formally established within corporate structure. · Established and proven whole-of-organisation co-ordination and management. |
· Executive Management fully and transparently involved in AM with appropriate levels of responsibility and accountability. · AM embedded in organisational culture. |
|
Organisational Capacity, Roles & Responsibilities |
· AM ‘champion’ embedded in Executive Management Team with executive authority. · AM organisational capacity & capability. · Clear roles & responsibilities and levels of authority. |
· All AM capability & capacity requirements in place. · Established structure, roles & responsibilities linked with size & nature of asset base. · Senior Managers fully aware of AM · Stakeholder needs communicated & documented. |
|
Policy, Objectives & Strategy |
· AM policy and strategy fully aligned with asset plan. · AM aligned with other organisational policies, e.g. sustainability. |
· AM fully aligned with organisation-wide policies and business strategy. · Endorsed by Executive Management Team. · AM strategy is whole-of-life based and continually updated using accurate and comprehensive information systems. |
|
Information Systems |
· AM information fully defined and supports development and implementation of AM information systems. · Information relevant to AM needs and reported to senior management and stakeholders. |
· Proactive planning of AM information requirements. · Regular consultation with stakeholders. · Information output focused on asset performance. · Information is actively analysed to inform strategy & decision-making. |
|
Asset Planning |
· Plans are integral with AM policy & Strategy, and business planning. · Based on risk management/ contingency plans, targets, asset criticality, and business/service requirements. Based on short, medium and long-term time horizons.· |
· Plans driven by corporate objectives. · Financial optimisation modelling and options testing techniques employed. |
|
In-use Asset Performance |
· Established procedures to monitor and measure performance of assets, e.g. condition, criticality, sustainability & effectiveness. · Performance objectives identified and used. · Performance linked to strategic priorities and risk. |
· Performance management supports business strategy and is an integral part of AM. · Performance evaluated against value for money, business effectiveness & sustainability. · Measured using accurate and comprehensive information systems. |
|
Acquisition & Disposal |
· Acquisition & disposal strategies integral to AM |
· Long-term strategic planning considers technological and market forces. |
|
Performance Review |
· AM strategic & operational review program implemented across the organisation. Use of KPI’s across the organisation.· |
· Evidence of continued improvement in AM capability and asset performance. |
|
Asset Management System Audit |
· Audit program based on risk assessments and corporate governance requirements. · Training requirements identified and are on-going. |
· Feedback sought from stakeholders. · Achieving benchmark efficiencies and effectiveness. |
6.5.3 Strategy for Skills, Processes and Continuous Improvement
Table 13: Continuous Improvement Strategy
|
Strategic Objective: Continuous Improvement |
Ongoing improvement in asset management competency and capacity. |
|
Item |
Strategy |
Action |
Status |
|
Asset Management Awareness, Knowledge and Understanding |
Enhancement and development of asset management practices on an ongoing basis. |
Develop awareness, training and development programs for all levels of staff and Elected Members that caters for induction and ongoing development. |
Progressing |
|
These programs will be planned to align with the implementation of the improvement strategy. |
To be addressed |
||
|
Develop a system of self- and external assessment. |
To be addressed |
||
|
Benchmark against other jurisdictions, WALGA, Department of Local Government requirements, and other bodies. |
To be addressed |
||
|
Maintain a process to track developments and innovations in best practice. |
To be addressed |
||
|
Skills & Experience |
Develop and acquire skills and experience necessary to fulfil the requirements of the IPRF in Asset Management |
Undertake skills audit. Identify required skills. Close gaps through a plan for recruitment, up-skilling & training. |
To be addressed |
7 Glossary of Terms
7.1 Definitions
The following terms are used in this framework.
“Assets” are future economic benefits controlled by the City as a result of a past transaction or event whereby:
· Its value can be measured reliably, and;
· Its value must exceed a stated materiality threshold being $5,000 or form part of a network asset group, and;
· It must be probable that future economic benefits of the asset will eventuate (i.e. the asset acquired supports the delivery of Council services to the community in line with Councils’ objectives).
“Asset Management” refers to the combination of management, financial, economic, and engineering and other practices applied to assets from their planning, acquisition, operation, maintenance, replacement and disposal, to ensure that the assets meet the priorities of the Strategic Community Plan with the objective of providing the required level of service in the most cost-effective manner.
“Asset Management Plan” refers to a long term plan that combines multi-disciplinary asset management techniques to outline the assets activities, program and resources applied to provide a defined level of service for each asset class over the lifecycle of the asset.
“Asset Management Strategy” means a strategy or approach for asset management.
“Asset – Current” refers to an asset that can easily be converted to cash within the next 12 months.
“Asset – Non Current” refers asset that cannot easily be converted to cash within next 12 months
“Attractive Item” refers to an item defined as below:
· has a value of less than $5k (exc GST );
· has an attractive nature;
· is prone to misappropriation for private use or theft.
“Council” means the elected council (comprising Councillors) of the City.
“Depreciation” is a systematic charge that recognises the wearing out or consumption of the non- current asset over its useful life.
“Gap Analysis” a method of assessing the gap between current asset management practices and the future desirable asset management practices.
“Infrastructure” comprises the asset sub-classes defined in section 5 of the Asset Management Framework and Guidelines issued by the Department of Local Government.
“Level of Service” describes the outputs or objectives of the activity the City intends to deliver to the customer. Service levels usually relate to quality, quantity, reliability, responsiveness, statutory functional requirements, environment, acceptability and cost.
“Life Expectancy” is the estimated or expected time between placing the asset into service and removing it from service.
“Life Cycle” means the phases of activities that an asset goes through, including planning, design, construction, acquisition, operation, maintenance, rehabilitation and disposal.
“Maintenance” means regular ongoing day-to-day work necessary to keep an asset operating to achieve its optimum life expectancy.
“Network Asset Group” refers to a collective group of assets; whilst individually do not function for their intended purpose and may be under the threshold of an asset defined herein, but collectively in a group of assets, functions as intended and exceeds the threshold of an asset, e.g. desktop computers, servers, laptops etc.
“Operations” means the regular activities to provide public health, safety and amenity and to enable the assets to function e.g. road sweeping, grass mowing, and cleaning, street lighting and graffiti removal.
“Renewal” means works to upgrade an asset, refurbish an asset or the replacement of part(s) of an asset to ensure continuing equivalent capacity or performance capability.
“Replacement” means the complete replacement of an asset that has reached the end of its life, to provide a similar or agreed alternative, level of service.
“Replacement Cost” means the cost of replacing an existing asset with an identical new asset.
“Risk” means probability and consequence of an event that could impact on the Council’s ability to meet its corporate objectives.
City means the collective City organisation.
“Strategic Community Plan” means the plan containing the long-term goals and strategies of the City.
“Stakeholders” are those people/sectors of the community that have an interest or reliance upon an asset and who may be affected by changes in the level of service of an asset.
“Upgrade” means enhancing an existing asset to provide higher level of service.
“Whole of Life Cost” refers to the total cost of an asset throughout its life cycle.
7.2 Abbreviations
AM – Asset Management
AMF - Asset Management Framework
AM Plan - Asset Management Plan
AM Policy – Asset Management Policy
AM Strategy – Asset Management Strategy
AMWG – Asset Management working group
GIS – Geographical Information System
IAMSC – Infrastructure Asset Management Steering Committee
IT – Information Technology
ICT – Information Communication Technology
IIMM – International Infrastructure Management Manual
LGPMC - Local Government and Planning Ministers’ Council
LOS - Level of Service
LTFP – Long Term Financial Plan
NAMAF - National Asset Management and Financial Planning Assessment Framework
NFSF – National Financial Sustainability Framework
O & M - Operations and Maintenance
WAAMI – West Australian Asset Management Improvement (Program)
WALGA – West Australian Local Government Association
APPENDIX A : The Asset Responsibility Matrix
The Asset Responsibility Matrix sets out general responsibilities for various stages of the asset lifecycle at an Asset Sub-Class Level. More detailed analysis of responsibilities for Asset Management activities will be undertaken and reported as part of the Asset Management Planning process.
Table 14: The Asset Responsibility Matrix
|
Element |
Description |
|
Owner |
The Asset Owner who is ultimately responsible for the asset. |
|
Client |
The Client who requires the asset to deliver services. |
|
Planning |
Asset Planners are responsible for planning to meet the needs of the community through the use of specific assets. Asset planning covers the following items: · Consultation with users · Identifying users' needs · Setting service levels · Identifying future demand · Risk identification |
|
Design |
Asset design covers the preparation of concept, preliminary and construction drawings. Where asset designs are prepared by external entities the officer responsible for Asset Design is responsible for their specification and procurement. |
|
Construction |
Construction deals with the physical acquisition of an asset, either by construction or purchase. The Asset Constructor is responsible for managing the acquisition and ensuring that the Council Tendering and Purchasing Guidelines are adhered to during that process. |
|
Operation |
Asset operation covers the day-to-day use of the asset. The officer responsible for Asset Operations uses the asset to provide a service to the community. Actions by asset operators could include: · Setting and managing lease arrangements · Monitoring and reviewing service levels · Responding to Citizen/user enquiries · Requesting additional capital works to increase the level of service |
|
Maintenance |
The Maintenance Manager is responsible for maintenance of the asset. This includes contact with citizens when requests for maintenance are received from users. |
|
Renewal |
The Manager responsible for Asset Renewal plans and executes major works to the asset that either result in a significant extension of its operating life or replacement of the asset at the end of its life. |
|
Disposal |
The Manager responsible for Disposal of an asset arranges for its disposal according to Council policy and statutory requirements. |
APPENDIX B : The Asset Management Cycle (Process)
The IPRF framework ensures a consistent approach to asset management. Figure 4 represents best practise stages of the Asset Management Cycle. The management of the assets on the basis of this cycle will ensure that the objectives of the City's AM Policy are met.
The headings in this section will be used to guide the detailed Improvement Plan in the Summary AM Plan.
Figure 4: Asset Management Cycle
A1. Organisational Objectives
The foundations of good asset management are:
· having an understanding of the of the aims and objectives;
· the adoption of an AM Policy and Asset Management Framework.
These foundations ensure that Asset Management Strategies and Plans are placed in the context of wider organisational issues, and developed to align the objectives of the City‘s assets with its business and service objectives.
A2. Asset Strategies and Plans
The AM Strategy and AM Plans define how the City manages its assets in terms of:
· The organisational arrangements for asset management;
· Corporate processes for assets;
· Performance measures and measurement;
· Data management; and,
· Capacity management.
The City's AM Strategy and AM Plan will be developed from:
· An understanding of the community, business and financial drivers behind the City’s aims and objectives;
· The service models that deliver the City services; and,
· An understanding and knowledge of the City existing asset base, i.e. condition, location, use, suitability, functionality and cost-in-use.
The structure of AM Plans will contain the following:
· Links with the CBP and LTFP;
· The goals and objectives, and service/business drivers that have asset implications;
· The financial context;
· The asset base gap: existing state vs. desired future state;
· 10-year vision for asset base;
· Critical success factors;
· Plan for each asset category (closing the gaps);
· Resource implications (capital and recurring expenditure implications; ICT and HR; investment and disposal strategies; and approach to sourcing and procurement);
· Performance management;
· Organisational arrangements for asset management, e.g. governance, roles and responsibilities, processes, data management and capacity management; and,
· Actions and milestones to deliver the strategy, including on-going strategy development, change and improvement.
A3. Programs
Programming is the translation of the asset strategy and plan into a program of projects for implementation. The CBP describes projects, which have implications for the asset base.
Asset Programs translate strategy and plans into detailed programs of action. This includes:
· The review of the asset base to identify potential projects;
· Project evaluation – Business Cases;
· Asset program development and evaluation;
· Financial planning for assets
A4. Delivery
The efficient and effective delivery of asset strategies and programs pose particular challenges in finding the most efficient way to deliver its services, such as:
· Resources and capability;
· Means of delivery;
· Project structure and governance;
· Project plans;
· Communications;
· Performance measurement; and
· Risk management.
A5. Review
This is the process of assessing the performance of the entire asset management system.
The Department of Local Government has set a number of standards and ratios that Western Australia local governments are expected to achieve over time. These also include encouragement for a process to ensure continuous improvement.
The City will be developing a set of metrics for the management of its asset base through key performance indicators, additional business ratios and benchmarking to enable positive action to be taken to improve delivery, efficiency and the quality of services to the community.
Key areas of performance to be addressed in the review process include:
· Organisational performance;
· Balanced scorecard;
· Key performance indicators;
· Asset performance;
· Benchmarking; and
Data validation.·
A6. Change and Improvement
The City recognises that asset management is an organisation-wide function and activity, which means that changes and improvement may be necessary to any and all parts of the organisation, and may be concerned with:
· The Asset Management Process
- Improving policy and strategy;
- Improving programming;
- Improving delivery;
- Improving review;
and,
· Contextual (Corporate) Areas
- Leadership;
- Culture;
- Customer service;
- Organisational structure, roles and responsibilities and governance;
- Resources, Skills and capacity;
- Data management.
Summary
Asset Management Plan
DISTRIBUTION SCHEDULE
|
Version No. |
Date |
Distribution |
Reference |
|
1.0 |
|
|
TRIM 13/76426 |
|
|
|
|
|
|
|
|
|
|
|
|
|
|
|
|
|
|
|
|
|
|
|
|
|
|
|
|
|
|
|
|
|
|
|
|
|
|
|
|
|
|
|
|
|
|
|
|
|
|
Table of Contents
1. Introduction
2. Summary of the Detailed Asset Management Plan
3. Scope of this Summary
4. Current AM Performance – Infrastructure Assets
4.1. What Infrastructure Assets do we currently have?
4.2. What is the condition of our Infrastructure Assets?
4.3. What is the current asset management position
1. 4.3.1............................................................................... Asset Management Plans
2. 4.3.2.................................................................................. Levels of Service (LOS)
3. 4.3.3............................... Asset Renewal Demand Predictions - Infrastructure Assets
4. 4.3.4............................................................................ Asset Management Practice
5. Data and System Requirements
5.1. Current Status
5.2. Asset Management Systems
5.3. Improvement
5. 5.3.1....................................................................... Common Corporate Framework
6. 5.3.2...................................................................... Asset Inventory and Information. 21
7. 5.3.3............................................................................................. Asset Condition
8. 5.3.4............................................................................... Asset Financial Reporting
9. 5.3.5................................................................... Maintenance & Renewal Programs
10. 5.3.6................................ Asset Maintenance, Renewal and Replacement Unit Rates
6. Glossary of Terms
6.1. Definitions
6.2. Abbreviations
6.3. References
APPENDIX A : Asset Components - Key Variables and Assumptions
APPENDIX B : Asset Condition Rating Description
APPENDIX C : Attributes of Core & Advanced AM Practices
APPENDIX D: Asset Management Gap Analysis
APPENDIX E : Asset Management Process Improvement Plan Template
1. Introduction
The City has responded to the Department of Local Government's (DLG) requirement to develop an Integrated Planning and Reporting Framework (IPRF) with the development of a a Draft 10 year Strategic Community Plan (2013/14 to 2022/23), which represents the Community's Long Term aspirations, inclusive of a 4 year Corporate Business Plan and a one year Operational Plan.
These plans are supported by a Resourcing Framework that outlines the City's capacity to deliver services and manage its assets over the next 10 years. The Resourcing Framework contains the following four plans:
· Long Term Financial Plan
· Strategic Asset Management Plan incorporating
- Asset Management Policy (AM Policy);
- Asset Management Strategy (AM Strategy); and
- Summary Asset Management Plan (Summary AM Plan, this document) and Detailed Asset Management Plans (AM Plans).
· Workforce Management Plan; and,
· Information and Communication Technology Strategic Plan.
Figure 1 below shows how the City's various plans relate to each other under the new IPRF and where the components of the Strategic Asset Management Plan fit into this structure.
Figure 1: Asset Management and the Integrated Planning and Reporting Framework
|
|
Assets are fundamental to Councils’ overall service delivery and planning. Responsibility for assets requires strong and informed Council and executive oversight to achieve and maintain sustainable asset management outcomes.
The City's AM Policy has provided the overarching key principles against which assets are to be managed to ensure that there is organisation-wide commitment to asset management, and the framework and objectives for the development of the AM Strategy and AM Plans.
The AM Strategy sets asset management objectives, practices and strategies for the improvement of the asset base and the asset management system, and drives the entire asset management process. It ensures the objectives of the AM Policy are implemented, and provides the management framework to enable the implementation of detailed AM Plans.
This document, the Summary AM Plan, summarises the outputs from the detailed AM Plans on the long term asset renewal demand predictions and provides the link to and supports the long-term financial planning and strategic planning. This is required to ensure that the appropriate level of funds and resources are available to continue to provide services to the community in accordance with Council’s objectives as set out in the Strategic Community Plan (SCP).
The Summary AM Plan also brings together corporate requirements such as Levels of Service and AM Data and Systems from the various detailed AM Plans and improvement planning summaries. More work is required in the areas of Accountabilities and Responsibilities, Risk Management and Future Demand impact. This document aims to provide a holistic view of the City's AM performance and it should be noted that all figures presented in this Plan are based on 2012 dollars.
This Summary AM Plan and the detailed AM Plans will:
· Demonstrate how the City will manage its assets and ensure service delivery continues in line with the aspirations of the SCP and CBP.
· Contain the basic tools to enable Council to make informed decisions on the allocation of resources in order to maintain all major assets to the standard required to satisfy service delivery needs.
· Ultimately provide guidance on the long-term (10 years) allocation of financial and physical resources required to ensure the continuing operational performance of the City assets.
· Set out how the council delivers service to the community on a long-term sustainable basis and the assets required to underpin service delivery.
· Capture and document corporate knowledge about assets and the required service levels to support service delivery.
2. Summary of the Detailed Asset Management Plan
Figure 2 shows the inputs and outputs for the development of detailed AM Plans, which is consistent with the processes described in the AM Strategy.
Figure 2: Asset Management Plan Development
The essential inputs for an AM Plan are:
· Asset performance standards derived from:
− Business and service objectives articulated in the Corporate Business Plan (CBP);
− Levels of service;
− Performance standards; and,
− Service demand drivers.
· Asset Details and Utilisation determined by:
− Location;
− Condition;
− Capacity & functionality;
− Utilisation;
− Cost-in-use;
− Value; and,
− Amenity.
· Asset Management Evaluation related processes including:
− Risk assessments;
− Renewal gap predictions;
− Prioritisation; and,
− Financial
context and LTFP.
The combination of these elements defines the optimum asset portfolio, which enables the development of the detailed AM Plans, in turn shaping strategies for Operation and Maintenance, Renewal and Replacement, Disposals and Capital Investment for new assets.
At this stage the City is developing its asset management capacity and capability. Together with the Asset Management Strategy, this Summary AM Plan will provide a pathway for further development of the detailed AM Plans that will contribute to the delivery of services to the community in the most efficient and effective manner.
This Summary AM Plan will provide:
· an overall summary of the City's asset performance;
· a summary of the associated long term asset renewal demand extracted from the detailed AM Plans; and,
· details of the corporate level actions and progress improvement tasks common to each of the detailed AM Plans.
3. Scope of this Summary
The assets considered in this summary at this time relate only to infrastructure assets which form the major part of the City's asset base. Data for other asset classes such as Land, ICT, Fleet, Plant & Equipment have yet to be included. These will be added in later revisions of this document.
Table 1 summarises the City's portfolio of infrastructure assets. Further breakdown of these assets to various asset types is provided later in this document. The estimated replacement cost of infrastructure assets is approaching $1.2 billion with a current asset renewal backlog, at the end of 2012/2013 financial year, estimated at $5.5 million.
The figures presented in this document are based on the best available information. Asset data will continually be reviewed and updated on an ongoing basis to improve the integrity and robustness of the information presented. These figures will be used in developing the City's long-term financial plans.
Note: Some groups are based on estimates and may rise as data is improved and values are revisited.
Table 1: Estimated Asset Replacement Cost – Infrastructure Assets
|
Asset Class |
Current Replacement Cost |
Estimated Written Down Value |
Predicted Value of Current Unfunded Renewals (Backlog) |
|
Infrastructure Assets |
$ 1,166,794,170 |
$ 1,020,322,772 |
$ 5,543,975 |
Infrastructure assets include the following asset groups and asset types:-
Transport Assets - Roads, Pathways, Kerbs, Carparks and Bridges (Underpasses).
Building Assets - Libraries, Public Halls, Multi-Purpose Community Facilities, Public Toilets, Houses, Museums, Council Offices, Leisure Centres and Amenity Buildings.
Stormwater Drainage Assets - Drains, Pipes, Culverts, Pits and Gross Pollutant Traps.
Park Assets - Parks, Gardens, Sports Ovals, Play Equipment, Irrigation Systems, Skate Parks, Tennis Courts, Golf Course, Park Furniture and Sports Field Lighting.
The above infrastructure asset types represent the major components of the asset class. There are other asset types, such as Conservation and Foreshore area assets and special street lighting assets owned by the City, that are yet to be included. Once data becomes available, this information will be included.
The current status and asset performance of Infrastructure Assets and associated activities are further discussed in Section 4.
4. Current AM Performance – Infrastructure Assets
The City has an ongoing commitment to sustainable asset management and determining its long term financial demand is a key component. The City needs to be able to predict how much money it needs now and in the long term for the provision of new, upgrading and renewal/rehabilitation of its assets to ensure the continued services provision through these assets. This information will in turn assist in the development and review of the City’s long-term financial plan.
To enable the City to confidently and reliably predict its asset needs including its renewal demand, the following key activities shall be included in the detailed AM Plans together with the establishment of the listed key input variables and assumptions:-
· Ensure that key asset data and information is recorded as assets are created and ensure that the asset inventory for all asset classes are kept up to date in the asset registers;
· Asset condition assessments are undertaken on a regular basis to enable predictions to be made on remaining life of assets;
· Renewal/replacement costs and unit rates are current and reliable to determine Current Replacement Cost (CRC);
· Estimated asset useful lives which are based on historical performance and/or information available within the industry;
· Asset renewal intervention condition levels established to reflect agreed levels of service for asset replacement, renewal or rehabilitation;
· Adopt asset deterioration curves that reflect the pattern of consumption for the various asset components; and
· Determine the City’s future demand and assumptions for predicting growth for new assets.
A summary of some of the key inputs, variables and assumptions for the various asset types/components used in the detailed AM Plans are listed in Appendix A. These key inputs have been used in predicting the City's long term asset renewal demand.
The intervention condition which represents the asset condition at which renewal is due before an asset reaches failure has been determined based on historical budget availability. However, this may not necessarily correlate with the optimum intervention point from an asset management perspective. From a strategic perspective, there may be an opportunity for Council to consider intervention levels based on desired Levels of Service.
The AM performance for infrastructure assets will be addressed within the following headings:-
· What Infrastructure Assets do we currently have? – Section 4.1
Provides a summary breakdown of asset values of the various asset groups.
· What is the condition of our Infrastructure Assets? – Section 4.2
Provides a summary breakdown of the asset condition profile of the various asset groups.
· What is the current asset management position? – Section 4.3
Provides a summary of the performance of asset related activities of the various asset groups in terms of :-
− Development of Asset Management Plans
− Levels of Service Performance
− Asset Renewal Demand Profile, Predictions and Performance
− Asset Management Practice and Improvements
4.1. What Infrastructure Assets do we currently have?
Tables 2 and Figures 2 provides a breakdown of infrastructure assets.
Figure 2: Percentage breakdown Asset Replacement Cost – Infrastructure Assets
Table 2: Estimated Asset Replacement Cost - Infrastructure Assets
|
Infrastructure Assets |
Estimated Current Replacement Cost |
Predicted Value of Current Unfunded Renewals (Backlog) |
|
Transport |
677,428,547 |
1,372,625 |
|
Road – Pavement |
263,360,281 |
0 |
|
Road – Seal |
160,435,241 |
1,166,580 |
|
Road – Kerb |
150,308,900 |
196,000 |
|
Pathway Assets |
88,230,570 |
0 |
|
Carpark Assets |
10,093,555 |
10,045 |
|
Bridge Structures |
5,000,000 |
0 |
|
Buildings |
218,243,197 |
801,250 |
|
Buildings - Structure |
** 154,403,843 |
183,105 |
|
Buildings - Roof |
25,758,897 |
82,485 |
|
Buildings - Services |
19,109,316 |
245,500 |
|
Buildings - Fitout |
18,971,142 |
290,160 |
|
Parks |
90,730,114 |
3,370,100 |
|
Playground Assets |
11,982,474 |
1,092,961 |
|
Irrigation Assets |
69,660,621 |
1,615,321 |
|
Park Structures |
8,748,615 |
582,418 |
|
Park Furniture & Equipment |
338,400 |
79,400 |
|
Stormwater Drainage |
180,392,313 |
0 |
|
Stormwater Drainage - Structures |
6,093,805 |
0 |
|
Stormwater Drainage - Assets |
174,298,508 |
0 |
|
Grand Total |
1,166,794,170 |
5,543,975 |
Notes: * Assets considered here are assets that depreciate over time (eg. does not include valuations for Road Formation – once constructed, does not require future reconstruction).
** Replacement cost for Building Structures are derived from deducting the Roof, Services & Fit‑out component costs from the full building replacement cost. Generally when the Structural Component of a building reaches the end of its life, all other components of the building are renewed (i.e. full building replacement).
4.2. What is the condition of our Infrastructure Assets?
Figure 3 and Table 3 show the current asset condition profile within each of the asset groups.
The chart in Figure 3 shows that a large percentage of the assets are in new to very good condition with approximately 98% of the total asset base at or below condition 5 (a condition rating of 0 represents a brand new asset and 10 represents assets that is failing). Under one percent of the asset base is at or above condition 8, which represents assets that require immediate attention.
Figure 3: Current Condition Profile by Asset Groups – Infrastructure Assets
Table 3: Current Condition Distribution by Asset Groups - Infrastructure Assets
|
Condition |
Asset Groups (Asset Replacement Cost and % of total asset base) |
Total All Asset Groups |
|||
|
Transport |
Stormwater Drainage |
Buildings |
Parks |
||
|
0 |
10,807,214 |
3,560,004 |
473,618 |
2,844,672 |
17,685,508 |
|
(0.88%) |
(0.29%) |
(0.05%) |
(0.23%) |
(1.52%) |
|
|
1 |
453,392,229 |
152,689,292 |
148,053,000 |
22,332,503 |
776,467,026 |
|
(36.79%) |
(12.39%) |
(15.63%) |
(1.81%) |
(66.55%) |
|
|
2 |
116,104,262 |
23,549,007 |
40,068,090 |
16,490,194 |
196,211,550 |
|
(9.42%) |
(1.91%) |
(4.23%) |
(1.34%) |
(16.82%) |
|
|
3 |
44,611,297 |
204,036 |
14,587,436 |
14,994,220 |
74,396,989 |
|
(3.62%) |
(0.02%) |
(1.54%) |
(1.22%) |
(6.38%) |
|
|
4 |
25,951,966 |
76,139 |
6,346,482 |
11,333,661 |
43,708,248 |
|
(2.11%) |
(0.01%) |
(0.67%) |
(0.92%) |
(3.75%) |
|
|
5 |
19,854,083 |
73,370 |
6,630,653 |
15,203,133 |
41,761,239 |
|
(1.61%) |
(0.01%) |
(0.70%) |
(1.23%) |
(3.58%) |
|
|
6 |
1,622,710 |
159,486 |
1,041,960 |
2,120,727 |
4,944,883 |
|
(0.13%) |
(0.01%) |
(0.11%) |
(0.17%) |
(0.42%) |
|
|
7 |
4,514,211 |
80,980 |
757,790 |
3,965,317 |
9,318,297 |
|
(0.37%) |
(0.01%) |
(0.08%) |
(0.32%) |
(0.80%) |
|
|
8 |
417,325 |
0 |
189,447 |
1,181,019 |
1,787,791 |
|
(0.03%) |
(0.00%) |
(0.02%) |
(0.10%) |
(0.15%) |
|
|
9 |
0 |
0 |
0 |
0 |
0 |
|
(0.00%) |
(0.00%) |
(0.00%) |
(0.00%) |
(0.00%) |
|
|
10 |
153,246 |
0 |
94,724 |
264,668 |
512,638 |
|
(0.01%) |
(0.00%) |
(0.01%) |
(0.02%) |
(0.04%) |
|
|
Totals |
677,428,547 |
180,392,313 |
218,243,197 |
90,730,114 |
1,166,794,170 |
|
(54.96%) |
(14.64%) |
(23.04%) |
(7.36%) |
(100.00%) |
|
4.3. What is the current asset management position
4.3.1. Asset Management Plans
The City has developed core AM Plans for a number of its asset groups namely:
· Roads;
· Pathways;
· Buildings; and
· Stormwater Drainage.
Reviews are currently in progress for the Road AM Plan and the Pathways AM Plan. These two AM Plans will be amalgamated to become a Transport Assets AM Plan incorporating roads, pathways, bridges and carparks. Street lighting will be included in future revisions of this Plan. The Building AM Plan has also been reviewed with the development of Parks AM Plan and Natural Areas AM Plan nearing completion.
In general, the core AM Plans address the following:
· Describe the asset (physical, financial);
· Describe the objective/purpose of the assets;
· Define the current levels of service;
· Describe future demand requirements for service delivery;
· Describe the risks associated with the assets;
· Define the intended time frame (lifecycle) of the asset or key components;
· Include financial information;
· Recognise the decline in service potential;
· State assumptions and confidence levels;
· Outline an improvement program;
· Identify key performance measures; and,
· Describe the process for regular reviews.
The format used for the AM Plan documents follow the Institute of Public Works Engineering Australia (IPWEA) AM Plan template and covers the following key elements addressing the above requirements:-
· Levels of service – specifies the services and levels of service to be provided by the City;
· Future demand – details how this will impact on future service delivery and how this is to be met;
· Life cycle management – details summary asset data, capacity, performance and condition, risk management issues and how the City will manage its existing and future assets to provide the required services;
· Financial summary – identifies what funds are required to provide the required services;
· Asset Management Practices; highlights current AM activities and improvement initiatives to advance AM to desired levels of AM practices.
· Plan Improvement and Monitoring – describes how the plan will be monitored to ensure it is meeting the City’s objectives and identify improvement opportunities in asset management practises within the City.
AM Plans are dynamic documents that should be updated periodically to be effective as a management tool and reference documents. The plans will reflect changes in objectives/policies, customer expectations, improvements in asset management systems and/or data.
4.3.2. Levels of Service (LOS)
The City currently does not have a formalised LOS framework in place and has partially documented service level standards for infrastructure assets within the detailed AM Plans. These are defined as Community and Technical LOS for each activity in the AM Plans.
A LOS framework will need to be developed and documented to enable a consistent approach in determining LOS standards and measurements. The different LOS standards are defined below along with the performance measures.
4.3.2.1. Community LOS
This is how the community relates to the service provided.
Community LOS may include appearance, level of cleanliness, maintenance responsiveness, quality and type of consumables, safety and accessibility.
In the AM Plans, the performance measurement of the LOS expected from the community has been to utilise the results of the City's biennial Community Perception Survey. These surveys commenced in 2002/2003.
In this survey, the community is asked to rate the importance of the City's various services and facilities to determine the following:-
· Overall satisfaction with the City;
· Perceived importance and satisfaction with services and facilities; and,
· Performance strengths, weaknesses and gaps.
Most services provided by the City are underpinned by assets in some way. These survey results provide strong indicators as to the importance and criticality of particular assets used in service delivery.
To date, community satisfaction relating to assets has generally been good, as reported in the Community Perception Surveys.
4.3.2.2. Technical LOS
Community and technical LOS can often mean the same thing, but can also be interpreted differently. For example, a stormwater pipe network can be designed to meet identified technical requirements and have sufficient hydraulic capacity to take water from Point A to Point B and in so doing protect property. However if the design results in an unacceptable visual addition to the streetscape it may not be meeting the community criteria in terms of appearance.
Technical LOS will be based on the asset policy, strategy and industry accepted standards or practises. Performance measures for this activitiy rely heavily on having a good asset management system in place to record relevant activities and tasks against time and cost. At present the City's asset management system lacks the ability to track performance monitoring of these activities. Further improvements in this area have been identified for implementation.
4.3.2.3. Compliance
This is how the City complies with legislation, codes, standards and practices, including internal policies and practices. This requirement is generally met as the City's minimum standards for the provision of infrastructure assets meets Australian Standards.
4.3.2.4. Internal Clients & Stakeholders
This is how the assets and the services provided by the internal service providers of the City are supporting the service objectives of internal clients, i.e. the asset owners.
Further clarity and documentation is required to ensure that all stakeholders are aware of their roles and responsibility for the various assets.
4.3.3. Asset Renewal Demand Predictions - Infrastructure Assets
Evaluating the City’s Infrastructure Renewal Demand is undertaken using available asset data. Data is extracted from the asset registers and analysed. The City currently uses a simple in‑house Asset Renewal Demand Prediction and Modelling tool which uses a series of spreadsheets loaded with asset data, together with pre‑determined modelling variables and assumptions (these are defined in Appendix A), to model future asset renewal demands. The results of the analysis are summarised in Figures 4 to 11 below.
Development of the City’s Renewal Demand Prediction and Modelling tool continues to be improved and enhanced for useability and to ensure the results are accurate and reliable. The Model has been reviewed by an independent consultant and is considered to be a sound and reasonable tool to use for predicting long term asset renewal demand.
4.3.3.1. Asset Renewal Demand Predictions (50 year profile)
Figure 4: Asset Renewal Demand (50 year Profile) – Transport Asset Group
Figure 5: Asset Renewal Demand (50 year Profile) – Buildings Asset Group
Figure 6: Asset Renewal Demand (50 year Profile) – Parks Asset Group
Figure 7: Asset Renewal Demand (50 year Profile) – Stormwater Drainage Asset Group
Figure 8: Asset Renewal Demand (50 year Profile) – Consolidated Infrastructure Assets
The asset renewal demand profiles shown above in Figures 4 to 8 show the 50 year predicted asset renewal profile assuming the assets are renewed as required in each financial year. It should be noted that the graphs above are based on existing assets and new assets which will be acquired in accordance with the ten year Capital Works Program. In addition to this an allowance of 3% has been made for future gifted assets and a nominal increase of 1% has been applied for future assets acquired beyond the ten year Capital Works Program (total nominal annual growth figure of 4% from Year 11).
The renewal demand for Transport Assets represents the largest component as depicted in Figure 8 followed by Park assets. The high renewal demand for Park assets in the 50 year profile is also due to the reoccurring renewal demand of the shorter life span Park assets over this period. A high number of Park assets have shorter lives as compared to Transport and Building assets. Playground assets and barbeques, for example, have useful lives ranging from 10 to 15 years.
The average predicted asset renewal demand in the first 10 years is $11.9M per annum. This average is expected to double to $19.5M per annum in the following 10 years between 2024 and 2033. The average predicted for the 10 years between 2034 and 2043 is significant being in the order of $27M per annum.
The City's current 2013/14, average ten year asset renewal budget allocation is $10.8M per annum. The City's needs to consider longer term budget strategies in order to manage the future impacts of the significant increase in the predicted renewal demand expected outside the current budgeting timeframe.
4.3.3.2. The 2013/14 Ten Year Asset Renewal Funding Performance
Figure 9 shows the 10 year profile of predicted asset renewal demand assuming assets are renewed as required in each financial year.
Figure 9: Asset Renewal Demand (10 year Profile) – Consolidated Infrastructure Assets
Figure 10 shows the current renewal funding allocation for infrastructure assets in the City’s draft 2013/14 Ten Year Capital Works Program and the resultant estimated asset renewal demand impact and the resultant value of unfunded renewal demand (backlog).
The chart in Figure 10 demonstrates that the City is currently managing its renewal demand with the current proposed renewal expenditure at least in the first 8 years. In year 9 and 10, the resultant value of unfunded renewals start to increase. Further asset renewal funding will be required in these years to bring the value of unfunded renewals to manageable levels. This can be achieved by considering a 20 year planning window.
Figure 10: Predicted Value of Unfunded Renewals– Consolidated Infrastructure Assets

Notes:
1. The City's planned renewal expenditure for years 2014 to 2023 (figures based on the draft 2013/14 Ten Year Long Term Financial Plan).
2. The Predicted Annual Renewal Demand Impact includes the value of unfunded renewal from previous year (backlog).
3. Positive backlog figures represents value of unfunded renewals while negative values represent the value of renewed assets that have yet to reach intervention. It should be noted that this graph represents one strategy to fund renewals.
4. The predicted value of unfunded renewals shown in each year is the total renewal demand inclusive of backlog less renewal funding allocated in that year.
4.3.3.3. DLG Key Performance Indicators (Asset Ratios) – Infrastructure Assets
The predicted Asset Performance Ratios resulting from the proposed 10 year Capital Renewal Expenditure detailed in the previous section is shown in Figure 11.
Figure 11: Predicted Asset Performance
Ratio Indicators – Infrastructure Assets Only
Based on Figure 11, the performance indicators are within reasonable limits over the next 8 years. This is consistent with the result of the predicted unfunded renewals depicted in Figure 10.
Both the Asset Consumption and Asset Sustainability Ratios will heavily be influenced by the high growth within the City of Wanneroo. These ratios will differ greatly in comparison to fully established Local Governments with little or no growth. The results of the calculated ratios are further discussed below:-
· Asset Consumption Ratio (ACR)
The ACR highlights the aged condition of physical assets. The basic standard set by the DLG is a ratio of no less than 50%. The current ACR for the City's Infrastructure Assets is estimated at 80%.
The indicative target is between 40 – 80%. This ratio is relatively high for Wanneroo due to its most valuable assets being relatively new. It is likely to remain high with continuing high growth anticipated with construction of new infrastructure assets.
· Asset Sustainability Ratio (ASR)
The ASR measures the extent of asset replacement at the end of useful life.
The basic standard set by the DLG is a ratio of no less than 90%. The current ASR for the City's Infrastructure Assets is estimated at 43%.
A ratio of 100% indicates that asset stock is being replaced at a sustainable level. It is recognised however that this may be 50% or less when asset portfolios are young. With the City's current mix of old and new assets and continued high growth, this figure is at an acceptable level. As growth declines and the asset stock ages, this ratio is expected to increase to industry acceptable levels.
· Asset Renewal Funding Ratio (ARFR)
The ARFR measures the capacity to fund asset renewal without increasing operating liabilities.
The basic standard set by the DLG is a ratio of between 75% and 95%. The current ARFR for the City's Infrastructure Assets is estimated at 75%.
The target for sustainable assets is between 95-105%. The indicators predicted in future years suggests that for the latter part of the 10 year capital works program, there is a need to increase renewal funding allocated where this ratio has dipped below the 60% mark.
It must be noted that the ASR and ACR ratios are dependent on calculating the Written Down Value of assets. At this stage the City has yet to revalue its asset based on Fair Value. This is being addressed as part of the improvement plan suggested in this the AM Strategy.
The calculations used here to determine the Written Down Value for infrastructure assets have been based on Depreciated Current Replacement Cost obtained from Asset Management databases.
4.3.4. Asset Management Practice
The City’s current level of AM practice and the desired level of AM practice for each asset group and type is summarised in Table 5. The various levels of AM practices are further discussed in Appendix C including the key attributes of core and advanced asset management.
Not all Asset Types will have the same appropriate asset management practices. The level of AM practice will in most instances be based on the level of risk exposure and consequences of failure. The higher the risk associated with failure, the higher the level of AM practices required.
Process improvement initiatives and tasks will be identified in order to close the gap between the current and the desired AM practices. It is intended that the City will progress toward the desired practise for infrastructure assets within the next five years.
It has also been identified as part of the development of the individual detailed AM Plans, that for significant Special Purpose Facilities, specific detailed AM Plans will need to be prepared to ensure the continued viability of each of these facilities (e.g. Aquamotion, Kingsway Sports Stadium, Civic Centre Admin Building, Wanneroo Library & Cultural Centre).
As a minimum, current asset management practices for infrastructure assets have been developed to meet minimum legislative requirements and to ensure community safety.
Improvements to Asset Management practices for infrastructure assets have included:
· Development of core AM Plans for the various infrastructure asset groups;
· Formation of Asset Working Groups for Buildings and Park assets;
· Identification of high risk critical assets;
· Development of asset inventory registers recorded at asset component level;
· Determination of Levels of Service for various asset types;
· Undertaking asset condition assessments and data recording of critical assets;
· Preparation of Capital Asset Renewal Programs for inclusion in the ten year Capital Works Program; and,
· Undertaking long term asset renewal demand predictions for incorporation into the Long Term Financial Plan.
The IPWEA NAMS.Plus program also provides a Gap Analysis tool to analyse the current level of AM practice in comparison to a desired level of practice and recommends priorities for improvement. This tool has been used to examine the City’s present position and the results of the analysis are included in Appendix D. The resultant recommended priorities for improvement in shown in the Table 4 below.
Table 4: Recommended Priorities for Asset Management Improvement Activities
|
Priority |
Practice Area |
|
Priority |
Practice Area |
|
1 |
Revaluation Process |
|
=7 |
Asset Management Strategy |
|
2 |
Sustainability Reporting |
|
=7 |
Reporting Asset Consumption |
|
3 |
Risk Management |
|
=8 |
Asset Management Accountability and Responsibility |
|
4 |
Service Levels and Delivery Costs |
|
=8 |
Asset Identification and Recording |
|
=5 |
Risk Management Process |
|
9 |
Future Demand Impacts |
|
=5 |
Life Cycle Costs and Investment Decisions |
|
10 |
Asset Condition Data |
|
6 |
Asset Data Maintenance |
|
11 |
Asset Management Plans |
|
=7 |
Long Term Financial Plan |
|
12 |
AM Policy |
Table 5: Current and Desired Level of AM Practice
|
Asset Group |
Asset Type |
LEVEL OF AM |
|||||||||||
|
Levels of Service |
Demand |
Asset Register |
Condition |
Risk |
Lifecycle Strategies |
||||||||
|
Current |
Desired |
Current |
Desired |
Current |
Desired |
Current |
Desired |
Current |
Desired |
Current |
Desired |
||
|
Transport Assets |
Roads |
C |
C |
C |
A |
C |
A |
I |
A |
M |
C |
C |
A |
|
Pathways |
C |
C |
C |
A |
C |
C |
C |
A |
M |
C |
C |
A |
|
|
Carparks |
C |
C |
C |
A |
C |
C |
C |
A |
M |
C |
C |
C |
|
|
Bridges |
C |
C |
C |
C |
C |
C |
C |
C |
M |
C |
C |
C |
|
|
Building Assets |
Critical Buildings |
C |
C |
C |
A |
C |
A |
C |
A |
M |
C |
C |
A |
|
Other Buildings |
C |
C |
C |
A |
C |
C |
C |
A |
M |
C |
C |
C |
|
|
Minor Structures |
C |
C |
C |
C |
C |
C |
C |
A |
M |
C |
C |
C |
|
|
Parks & Natural Area Assets |
Playground Equipment |
C |
A |
C |
A |
C |
A |
I |
A |
M |
C |
C |
A |
|
Irrigation Assets |
C |
C |
C |
C |
C |
C |
C |
A |
M |
C |
C |
A |
|
|
Park Structures |
C |
C |
C |
C |
C |
C |
C |
C |
M |
C |
C |
C |
|
|
Park Furniture |
C |
C |
M |
C |
C |
C |
C |
C |
M |
C |
C |
C |
|
|
Sports Lighting |
M |
C |
C |
A |
C |
I |
C |
C |
M |
C |
C |
A |
|
|
Sporting Surfaces |
M |
C |
M |
C |
C |
C |
C |
C |
M |
C |
C |
C |
|
|
Conservation Structures |
C |
C |
C |
C |
M |
C |
C |
C |
M |
C |
C |
C |
|
|
Foreshore Structures |
C |
C |
C |
C |
M |
C |
C |
C |
M |
C |
C |
C |
|
|
Stormwater Drainage Assets |
Drainage System |
C |
C |
C |
C |
C |
C |
C |
C |
M |
C |
C |
C |
|
Sumps & Fencing |
C |
C |
C |
C |
C |
C |
C |
C |
M |
C |
C |
C |
|
|
Special Structures |
C |
C |
C |
C |
C |
C |
C |
C |
M |
C |
C |
C |
|
|
Significant Special Purpose Facility |
Aquamotion |
C |
A |
C |
A |
C |
A |
C |
A |
M |
C |
C |
A |
|
Civic Centre |
C |
C |
C |
C |
C |
A |
C |
A |
M |
C |
C |
A |
|
|
WLCC |
C |
A |
C |
A |
C |
A |
C |
A |
M |
C |
C |
A |
|
|
Clarkson Library |
C |
A |
C |
A |
C |
A |
C |
C |
M |
C |
C |
A |
|
|
Kingsway Indoor Stadium |
C |
A |
C |
C |
C |
A |
C |
A |
M |
C |
C |
A |
|
|
Wangara Recycling Centre |
M |
C |
C |
C |
C |
A |
C |
C |
M |
C |
C |
C |
|
|
Carramar Golf Course |
C |
A |
C |
C |
C |
A |
C |
I |
M |
C |
C |
A |
|
|
Marangaroo Golf Course |
C |
A |
C |
C |
C |
A |
C |
I |
M |
C |
C |
A |
|
|
Kingsway Sports Complex |
C |
A |
C |
C |
C |
A |
C |
A |
M |
C |
C |
A |
|
|
Ashby Operation Centre |
C |
C |
C |
C |
C |
I |
C |
I |
M |
C |
C |
C |
|
|
Heritage Structures |
C |
C |
n/a |
n/a |
C |
C |
C |
C |
M |
C |
C |
C |
|
Legend: M
– Minimum C – Core I – Intermediate A -
Advanced
5. Data and System Requirements
5.1. Current Status
The City has an asset register within its financial system and asset data in numerous spreadsheets and GIS tables for the management of its assets. The financial asset register in particular for infrastructure assets is not sufficiently detailed to enable proper reporting of asset performance and expenditures. Currently, comprehensive infrastructure asset data is held outside of the finance asset register and managed by Infrastructure Directorate's Asset Management Team.
A comprehensive audit of existing data and systems needs to be undertaken and improvements identified in order to determine the way forward.
The corporate finance system has the provision for comprehensive financial reporting including audit trails and depreciation calculation, reporting thresholds, records of acquisitions and disposal. However, the current account structure and finance register is not sufficiently detailed enough with respect to the asset register to produce the required asset performance reports and does not align with componentising of asset records either.
The City's financial system, in its current configuration, does not have the functionality to easily and reliably produce maintenance and renewal expenditures reports. It is not able to record componentised asset data particularly with infrastructure assets. There are no defined processes to plan long-term for operation, maintenance, renewal and upgrade planning for existing assets.
Improvement actions to the current system have been identified and listed in the AM Strategy which will progress the changes required to move the City forward in this area.
Properly configured computer based asset management systems have the capacity to record, store and analyse significant quantities of asset data for asset management purposes. Such systems can also provide connectivity with other corporate information systems and databases. The power of current computing technology enables a comprehensive and cost-effective approach to asset identification, analysis and management. This ability, coupled with the availability of powerful, flexible software, enables complex analysis and reporting functions to be performed.
5.2. Asset Management Systems
The City's Civica Authority system is the organisation’s corporate financial management system. The City is currently in the process of implementing the Asset Management Module of the Authority system. The implementation of this Module is a significant project and, once completed, will be a major driver for improved asset performance reporting.
The City's objectives in selecting and implementing this asset management system are as follows:
· To have a central repository for all asset data;
· To undertake lifecycle management of all Council asset categories;
· To facilitate an asset management culture;
· To reduce the overall costs and risks associated with Council assets;
· To implement a system that is flexible enough to accommodate the variations in the management of the various asset categories;
· To provide the ability to add advanced asset management functionality as the Council matures with respect to asset management; and,
· To implement an integrated system that will support the concept of once only data entry and be easily interfaced with other corporate applications.
Once implemented, the asset system will be supplemented with other integrated systems and stand alone modelling tools. Integration with corporate systems such as GIS and the Finance System is a key component of the implementation project.
5.3. Improvement
5.3.1. Common Corporate Framework
A common corporate framework based on asset hierarchy needs to be developed, including common asset numbers, linkage across asset registers and account numbers.
Current Status:
· Infrastructure Assets – data managed by Asset Management Service Unit independent of Finance System.
· ICT Assets – data managed by IT Service Unit with some information stored in corporate system with linkages to the Finance System while other data independently stored.
· Fleet Assets - data managed by Fleet Assets Services with data stored in corporate system with linkages to the Finance System.
A process needs to be put in place to amalgamated all databases to a single data source wherever possible, and responsibility assigned for the maintenance of the asset class databases.
5.3.2. Asset Inventory and Information
An accurate and reliable asset database of asset information is critical to the successful management of assets. The data needs to be complete, checked, verified and cleansed by the operational asset class owners. All asset databases must be linked and common to the Finance System.
5.3.3. Asset Condition
Collection of current asset condition data on all assets including historically recording the deterioration pattern is important to enable future predictions on renewal demand and support the LTFP. The City needs to ensure that there are systems and processes in place to record and keep asset condition data up to date.
5.3.4. Asset Financial Reporting
The City will ensure that its account structure and finance register system is adequately set up and sufficiently componentised to allow the reporting of operating, maintenance, renewal, upgrade and new expenditure at each component level and by asset hierarchy in order to aid LOS decision making, LTFP and also satisfy the requirements of the IPRF.
5.3.5. Maintenance & Renewal Programs
The City will implement systems for developing facility management and asset maintenance and renewal programs and associated cash flows so that it can transition to predictive maintenance and renewal programs expenditure, rather than a reactive breakdown approach.
5.3.6. Asset Maintenance, Renewal and Replacement Unit Rates
The City will develop a schedule of unit rates for maintenance and renewal as a basis for the preparation of reliable future estimates of maintenance and renewal demand.
6. Glossary of Terms
6.1. Definitions
The following terms are used in this framework.
“Assets” are future economic benefits controlled by the City of Wanneroo as a result of a past transaction or event whereby:
· Its value can be measured reliably, and;
· Its value must exceed a stated materiality threshold being $5,000 or form part of a network asset group, and;
· It must be probable that future economic benefits of the asset will eventuate (i.e. the asset acquired supports the delivery of Council services to the community in line with Councils’ objectives)
“Asset Management” refers to the combination of management, financial, economic, and engineering and other practices applied to assets from their planning, acquisition, operation, maintenance, replacement and disposal, to ensure that the assets meet the priorities of the Strategic Community Plan with the objective of providing the required level of service in the most cost-effective manner.
“Asset Management Plan” refers to a long term plan that combines multi-disciplinary asset management techniques to outline the assets activities, program and resources applied to provide a defined level of service for each asset class over the lifecycle of the asset.
“Asset Management Strategy” means a strategy or approach for asset management.
“Asset – Current” refers to an asset that can easily be converted to cash within the next 12 months.
“Asset – Non Current” refers asset that cannot easily be converted to cash within next 12 months
“Council” means the elected council (comprising Councillors) of the City of Wanneroo.
“Depreciation” is a systematic charge that recognises the wearing out or consumption of the non- current asset over its useful life.
“Gap Analysis” a method of assessing the gap between current asset management practices and the future desirable asset management practices.
“Infrastructure” comprises the asset sub-classes defined in section 5 of the Asset Management Framework and Guidelines issued by the Department of Local Government.
“Level of Service” describes the outputs or objectives of the activity the City intends to deliver to the customer. Service levels usually relate to quality, quantity, reliability, responsiveness, statutory functional requirements, environment, acceptability and cost.
“Life Expectancy” is the estimated or expected time between placing the asset into service and removing it from service.
“Life Cycle” means the phases of activities that an asset goes through, including planning, design, construction, acquisition, operation, maintenance, rehabilitation and disposal.
“Maintenance” means regular ongoing day-to-day work necessary to keep an asset operating to achieve its optimum life expectancy.
“Network Asset Group” refers to a collective group of assets; whilst individually do not function for their intended purpose and may be under the threshold of an asset defined herein, but collectively in a group of assets, functions as intended and exceeds the threshold of an asset, e.g. desktop computers, servers, laptops etc.
“Operations” means the regular activities to provide public health, safety and amenity and to enable the assets to function e.g. road sweeping, grass mowing, and cleaning, street lighting and graffiti removal.
“Renewal” means works to upgrade an asset, refurbish an asset or the replacement of part(s) of an asset to ensure continuing equivalent capacity or performance capability.
“Replacement” means the complete replacement of an asset that has reached the end of its life, to provide a similar or agreed alternative, level of service.
“Replacement Cost” means the cost of replacing an existing asset with an identical new asset.
“Risk” means probability and consequence of an event that could impact on the Council’s ability to meet its corporate objectives.
“Strategic Community Plan” means the plan containing the long-term goals and strategies of the “Local Government Name”.
“Stakeholders” are those people/sectors of the community that have an interest or reliance upon an asset and who may be affected by changes in the level of service of an asset.
“Upgrade” means enhancing an existing asset to provide higher level of service.
“Whole of Life Cost” refers to the total cost of an asset throughout its life cycle.
6.2. Abbreviations
AM – Asset Management
AM Plan –Asset Management Plan
AM Strategy –Asset Management Strategy
AMWG – Asset Management working group
DLG – Department of Local Government
FMSG - Fleet Management Steering Group
GIS – Geographical Information System
ICT – Information Communication Technology
IT – Information Technology
IAMSC – Infrastructure Asset Management Steering Committee
IIMM – International Infrastructure Management Manual
LGPMC - Local Government and Planning Ministers’ Council
LOS - Level of Service
LTFP – Long Term Financial Plan
NAMAF - the National Asset Management and Financial Planning Assessment Framework
NFSF – National Financial Sustainability Framework
O & M - Operations and Maintenance
WAAMI – West Australian Asset Management Improvement (Program)
WALGA – West Australian Local Government Association
6.3. References
 The WAAMI Program
- http://walga.asn.au/WAAMI/what-is-waami.html
- Explanation for WAAMI and NAMS.Plus Program
(click pdf icon on the right to view document…..)
Integrated Planning Framework
- http://integratedplanning.dlg.wa.gov.au/AboutIntegratedPlanning.aspx
Asset Management Policy
- TRIM Reference (2409) - 10/1009
Infrastructure Asset Management Steering Committee : Terms of Reference
- TRIM Reference (4031) - 10/21802
Asset Management Plans
- Roads AM Plan (Council Report IN01-09/10): TRIM Ref (3977) - 10/40977
- Pathways AM Plan (Council Report IN01-11/10): TRIM Ref (3977) - 10/29759
- Buildings AM Plan (Council Report IN01-05/10): TRIM Ref (3978) - 10/118165
- Stormwater Drainage AM Plan (Council Report IN02-10/11): TRIM Ref (3977) - 11/118081
- Parks AM Plan (Draft): TRIM Ref (3979) - 12/112663
IPWEA NAMS.Plus - http://www.ipwea.org.au/assetmanagement/aboutnamsau/namsplus/
- An initiative developed by the Institute of Public Works Engineering Australia (IPWEA) known as NAMS.Plus to assist councils in developing asset management plans and implement sustainable asset management practices. A suite of templates, guidelines and other tools has been developed based upon the IPWEA International Infrastructure Management Manual 2011. Many councils have embraced asset management and joined the NAMS.Plus program in order to be better prepared in asset management for the future. The outcomes of this program and the supporting asset management documentation will assist Council in improving its ability to meet its goals and objectives in a way that best serves its customers.
APPENDIX A : Asset Components - Key Variables and Assumptions
A1. Pattern of Asset Consumption Curves
The equation used for calculating the pattern of consumption of assets is indicated below:-
![]()
where;
Age = age of the asset;
L = Expected Life of asset to failure;
n = deterioration factor – deviation factor from straight line deterioration.
Condition = Asset condition rated at 0 to 10 ( 0 being brand new and 10 being fail)
The deterioration curves are represented in the chart below.
e.g. if the intervention condition
is 8 for an asset represented by a curve with n of 1.5, asset renewal would
be due at around 90% of it expected life.![]()

The abbreviated terms used in the tables shown in 'Section A2' are shown below:
|
Abbreviation |
Description |
|
Unit |
Unit of measure for the asset type. |
|
L |
Expected Asset Life to Failure (years). |
|
Intervention Condition. |
Intervention Condition – the asset condition at which renewal is due before asset reaches failure (condition rating between 0 and 10: where 0 is for brand new and 10 is for fail). |
|
Asset Useful Life |
Asset life at intervention condition prior to renewal being triggered (years). |
|
n |
Deterioration factor which represents the Pattern of Consumption Curve used for the asset type. |
A2. Asset Components and Variables Used
The tables below show the adopted variables used representing the asset characteristics for each of the asset types or component shown.
TRANSPORT ASSETS GROUP
|
Asset Sub Group |
Asset Type/ Component |
Unit of Measure |
Expected Life, L (yrs) |
Intervention Condition (0 - 10) |
Asset Useful Life (yrs) |
n |
|
Road Formation |
Road Formation |
m2 |
Infinite |
N/A |
N/A |
N/A |
|
Road Pavement |
Pavement (High Traffic) Urban |
m2 |
85 |
7.0 |
75 |
1.8 |
|
Pavement (Low Traffic) Urban |
m2 |
100 |
8.0 |
94 |
1.8 |
|
|
Road Seal |
Asphalt Seal (High Traffic) Urban |
m2 |
25 |
7.0 |
22 |
2.0 |
|
Asphalt Seal (Low Traffic) Urban |
m2 |
30 |
8.0 |
28 |
2.0 |
|
|
Spray Seal (High Traffic) Urban |
m2 |
18 |
7.0 |
15 |
1.8 |
|
|
Spray Seal (Low Traffic) Urban |
m2 |
20 |
8.0 |
18 |
1.8 |
|
|
Road Kerb |
Road Kerbs |
m |
55 |
8.0 |
50 |
1.5 |
|
Bridge Structures |
Underpasses |
unit |
100 |
8.0 |
96 |
2.0 |
|
Carpark Assets |
Carpark Kerbing |
m |
50 |
8.0 |
47 |
1.8 |
|
Carpark Pavement |
m2 |
85 |
8.0 |
80 |
1.8 |
|
|
Carpark Seal |
m2 |
25 |
8.0 |
23 |
1.5 |
|
|
Pathway Assets |
Pathways (Asphalt/Bitumen) |
m2 |
30 |
8.0 |
28 |
1.8 |
|
Pathways (Brick) |
m2 |
50 |
8.0 |
47 |
1.8 |
|
|
Pathways (Concrete) |
m2 |
70 |
8.0 |
66 |
1.8 |
BUILDING ASSETS GROUP
|
Asset Sub Group |
Asset Type/ Component |
Unit of Measure |
Expected Life, L (yrs) |
Intervention Condition (0 - 10) |
Asset Useful Life (yrs) |
n |
|
Buildings - Structure |
Structure T90 |
m2 |
90 |
8.0 |
86 |
2.0 |
|
Structure T50 |
m2 |
50 |
8.0 |
48 |
2.0 |
|
|
Structure T30 |
m2 |
30 |
8.0 |
28 |
2.0 |
|
|
Buildings - Roof |
Roof T90 |
m2 |
90 |
8.0 |
81 |
1.5 |
|
Roof T45 |
m2 |
45 |
8.0 |
40 |
1.5 |
|
|
Roof T30 |
m2 |
30 |
8.0 |
27 |
1.5 |
|
|
Buildings - Services |
Services T10 |
unit |
10 |
8.0 |
8 |
1.0 |
|
Services T15 |
unit |
15 |
8.0 |
12 |
1.2 |
|
|
Services T20 |
unit |
20 |
8.0 |
18 |
1.5 |
|
|
Services T30 |
unit |
30 |
8.0 |
27 |
1.5 |
|
|
Buildings - Fitout |
FitOut T10 |
m2 |
10 |
7.0 |
8 |
1.5 |
|
FitOut T20 |
m2 |
20 |
7.0 |
15 |
1.2 |
|
|
FitOut T30 |
m2 |
30 |
7.0 |
25 |
1.5 |
STORMWATER DRAINAGE ASSETS GROUP
|
Asset Sub Group |
Asset Type/ Component |
Unit of Measure |
Expected Life, L (yrs) |
Intervention Condition (0 - 10) |
Asset Useful Life (yrs) |
n |
|
Stormwater Drainage Assets |
Pipes |
m |
100 |
8.0 |
94 |
1.8 |
|
Pits |
unit |
100 |
8.0 |
94 |
1.8 |
|
|
Underground Cells |
unit |
50 |
8.0 |
42 |
1.2 |
|
|
Stormwater Drainage - Structures |
Gross Pollutant Trap |
unit |
100 |
8.0 |
85 |
1.2 |
|
Sump Fencing |
m |
50 |
8.0 |
45 |
1.5 |
PARK ASSETS GROUP
|
Asset Sub Group |
Asset Type/ Component |
Unit of Measure |
Expected Life, L (yrs) |
Intervention Condition (0 - 10) |
Asset Useful Life (yrs) |
n |
|
Playground Assets |
Playground, Coastal |
unit |
12 |
8.0 |
10 |
1.2 |
|
Playground, Non‑Coastal |
unit |
15 |
8.0 |
13 |
1.5 |
|
|
Softfall, Coastal |
m2 |
12 |
8.0 |
10 |
1.2 |
|
|
Softfall, Non-Coastal |
m2 |
15 |
8.0 |
13 |
1.5 |
|
|
Irrigation Assets |
Bore, Pump, Motor & Flow Meter |
unit |
20 |
9.0 |
19 |
1.5 |
|
Irrigation Controller |
unit |
15 |
8.0 |
12 |
1.2 |
|
|
Irrigation Mainline |
m2 |
30 |
8.0 |
25 |
1.2 |
|
|
Park Structures |
BBQ, Coastal |
unit |
12 |
8.0 |
10 |
1.2 |
|
BBQ, Non-Coastal |
unit |
15 |
8.0 |
13 |
1.5 |
|
|
Park Shelters - Special Gazebo |
m2 |
30 |
8.0 |
25 |
1.2 |
|
|
Park Shelters, Coastal |
m2 |
15 |
8.0 |
12 |
1.2 |
|
|
Park Shelters, Non‑Coastal |
m2 |
20 |
8.0 |
18 |
1.5 |
|
|
Sports Surfaces |
Sports Surfaces - Acrylic |
m2 |
10 |
8.0 |
8 |
1.2 |
|
Sports Surfaces - Asphalt |
m2 |
30 |
8.0 |
27 |
1.5 |
|
|
Sports Surfaces - Compressed Limestone |
m2 |
50 |
8.0 |
40 |
1.0 |
|
|
Sports Surfaces - Concrete |
m2 |
70 |
8.0 |
63 |
1.5 |
|
|
Park Furniture & Equipment |
Sports Lighting Luminaires |
unit |
8 |
8.0 |
6 |
1.0 |
APPENDIX B : Asset Condition Rating Description
Asset condition is measured using a 0 – 10 rating system and described in the Table below:-
|
Rating |
Generic Description of asset condition |
Implication |
|
0 |
A new asset or an asset recently rehabilitated back to new condition. |
Continue planned and reactive maintenance 0 – 50% asset life
|
|
1 |
A near new asset with no visible signs of deterioration often moved to condition 1 based upon the time since construction rather than observed condition decline. |
|
|
2 |
An asset in excellent overall condition. There would only be very slight condition decline but it would be obvious that the asset was no longer in new condition. |
|
|
3 |
An asset in very good overall condition but with some early stages of deterioration evident, but the deterioration still minor in nature and causing no serviceability problems. |
|
|
4 |
An asset in good overall condition but with some obvious deterioration evident, serviceability would be impaired very slightly. |
|
|
5 |
An asset in fair overall condition. Deterioration in condition would be obvious and there would some serviceability lost. |
Continue planned and reactive maintenance 50 - 75% asset life Consideration toward upgrades for certain asset types |
|
6 |
An asset in fair to poor overall condition. The condition deterioration would be quite obvious. Asset serviceability would now be affected and maintenance cost would be rising. |
|
|
7 |
An asset in poor overall condition. Deterioration would be quite severe and would be starting to limit the serviceability of the asset. Maintenance cost would be high. |
|
|
8 |
An asset in very poor overall condition with serviceability now being heavily impacted upon by the poor condition. Maintenance costs would be very high and the asset would be at a point where it needed to be rehabilitated. |
Renewal 75 – 100% asset life |
|
9 |
An asset in extremely poor condition with severe serviceability problems and needing rehabilitation immediately. Could also be a risk to remain in service. |
|
|
10 |
An asset that has failed is no longer serviceable and should not remain in service. There would be an extreme risk in leaving the asset in service. |
APPENDIX C : Attributes of Core & Advanced AM Practices
The various levels of Asset management Practices are defined below:
Minimum (M): The absolute basic level of asset management. Data is presented in top-down models.
Core (C): Asset Management which relies primarily on the use of an asset register, maintenance management systems, top down condition assessment, simple risk assessment and defined levels of service, in order to establish a long-term cash flow projection.
Intermediate (I): Those asset groups that may be defined as Intermediate are either undergoing the process of moving from Core to Advanced status or would benefit by having more that a core level of Asset Management Practice but does not require advanced Asset Management Practice.
Advanced (A): Asset Management which employs predictive modelling, risk management and optimised decision making techniques to establish asset lifecycle treatment options and related long term cash flow predictions.
The table below summarises the key attributes of Core and Advanced Asset Management practices.
|
Attribute |
Core |
Advanced |
|
Levels of Service |
Asset contribution to councils objectives & basic LOS defined. LOS performance measures in place. |
Technical and customer LOS are integral to decision making and business planning. |
|
Demand |
Forecasts based on experienced staff predictions together with historical trends (population growth). |
Based on mathematical analysis of past trends and primary demand factors. Linked to risk assessment of different scenarios. |
|
Asset Register |
Basic physical information in spreadsheet, limited components, age based valuation. |
Information on work history, type & cost, condition. Recorded at component level. Optimised data collection program. Critical assets identified. High confidence in data. |
|
Condition |
Condition assessment at group level (top down). Supports minimum requirements for managing critical assets. |
Condition information supports risk management, lifecycle decision making and financial reporting. |
|
Risk |
Critical assets defined. Documented risk management strategies for critical assets. |
Formal risk management policy in place. Risk is integrated into all aspects of decision making. Risk is quantified and risk mitigation options evaluated. |
|
Lifecycle Strategies |
AM decisions based in part on staff judgement and agreed corporate priorities. Formal decision making techniques are used on major projects & programmes. |
Formal decision making & prioritisation techniques applied to all operational & capital programmes. Formal risk based sensitivity is carried out. |
APPENDIX D: Asset Management Gap Analysis
The IPWEA NAMS.Plus program provides a Gap Analysis tool to analyse the current level of AM practice in comparison to a desired level of practice and recommends priorities for improvement. This tool has been used to examine the City’s present position and the results of the analysis are summarised in the tables below. The detailed analysis data has also been included following the summary.
Table D1: Summary of the Asset Management Capability Gap Analysis
Table D2: Recommended Priorities for Asset Management Improvement Activities
|
Priority |
Practice Area |
|
Priority |
Practice Area |
|
1 |
Revaluation Process |
|
=7 |
Asset Management Strategy |
|
2 |
Sustainability Reporting |
|
=7 |
Reporting Asset Consumption |
|
3 |
Risk Management |
|
=8 |
Asset Management Accountability and Responsibility |
|
4 |
Service Levels and Delivery Costs |
|
=8 |
Asset Identification and Recording |
|
=5 |
Risk Management Process |
|
9 |
Future Demand Impacts |
|
=5 |
Life Cycle Costs and Investment Decisions |
|
10 |
Asset Condition Data |
|
6 |
Asset Data Maintenance |
|
11 |
Asset Management Plans |
|
=7 |
Long Term Financial Plan |
|
12 |
AM Policy |
Table D3: Detailed Asset Management Capability Gap Analysis
|
1. Gap Analysis - Stewardship |
Importance Rating: 3: Essential, 2: Important, 1: Somewhat Important |
||||||
|
Question |
Capability Levels |
Capability |
Importance Rating |
Gap |
Weighted Gap |
||
|
Desired |
Present |
||||||
|
Asset Management Policy |
|
|
|
|
|
||
|
Does your council have an adopted AM Policy? |
1. No, not planned 2. Planned in next 12 months 3. Under development 4. Developed, not adopted by council 5. Yes |
5.0 |
5.0 |
3.0 |
0.0 |
0.0 |
|
|
Asset Management Strategy |
|
|
|
|
|
||
|
Does your council have an adopted AM Strategy? |
1. No, not planned 2. Planned in next 12 months 3. Under development 4. Developed, not adopted by council 5. Yes |
5.0 |
4.0 |
3.0 |
1.0 |
3.0 |
|
|
Risk Management Process |
|
|
|
|
|
||
|
Does your council have a system for managing asset related risks either as part of a corporate risk management system OR |
1. No, not planned 2. Planned in next 12 months 3. Under development 4. Developed, not adopted by council 5. Yes |
4.0 |
2.0 |
2.0 |
2.0 |
4.0 |
|
|
Within an AM Plan for Transport Assets? |
4.0 |
2.0 |
2.0 |
2.0 |
4.0 |
||
|
Within an AM Plan for Building Assets |
4.0 |
2.0 |
2.0 |
2.0 |
4.0 |
||
|
Within an AM Plan for Park Assets |
4.0 |
2.0 |
2.0 |
2.0 |
4.0 |
||
|
Within an AM Plan for Drainage Assets |
4.0 |
2.0 |
2.0 |
2.0 |
4.0 |
||
|
Accountability and Responsibility for Asset Management |
|
|
|
|
|
||
|
Does your council have a cross-functional approach to asset management? |
1. No, not planned 2. Planned in next 12 months 3. Under development 4. For some asset categories 5. Yes, for all asset categories |
4.0 |
4.0 |
3.0 |
0.0 |
0.0 |
|
|
Does your council’s Executive Management Team consider AM issues at the corporate level? |
4.5 |
4.0 |
2.0 |
0.5 |
1.0 |
||
|
What is the primary role of your council’s Asset Management Team? |
1. No AM Team 2. Capital works prioritisation for some/all services 3. Capital program management for some/all services 4. Coordination of lifecycle AM activities for some services 5. Coordination of lifecycle AM activities for all services |
4.5 |
3.0 |
3.0 |
1.5 |
4.5 |
|
|
Question |
Capability Levels |
Capability |
Importance Rating |
Gap |
Weighted Gap |
||
|
Desired |
Present |
||||||
|
At what level are outcomes of the AMT accepted? |
1. No AM Team 2. AM Team planned in 12 mths 3. Specialist Officer 4. Department Head 5. EMT/CEO |
4.5 |
4.5 |
2.0 |
0.0 |
0.0 |
|
|
Does your council's Audit Committee consider AM issues? |
1. No Audit Committee 2. Audit Committee planned in 12 months 3. Reporting as required 4. Regular meeting agenda item 5. Audit Committee considers sustainability indicators |
4.0 |
3.0 |
1.0 |
1.0 |
1.0 |
|
|
Are AM accountabilities and responsibilities defined in managers’ position statements? |
1. No 2. Planned in 12 months 3. Being developed 4. In Managers' position statements 5. CEO's pos. statements includes indicators for maintenance of appropriate assets to provide services |
4.0 |
1.0 |
1.0 |
3.0 |
3.0 |
|
|
Sustainability Reporting |
|
|
|
|
|
||
|
Does your council report on its financial sustainability? |
1. No sustainability indicators developed 2. Sustainability indicators planned in 12 months 3. Sustainability indicators developed 4. Sustainability reported as required 5. Sustainability reported in Annual Reports |
4.5 |
2.0 |
2.0 |
2.5 |
5.0 |
|
2. Gap Analysis – Asset Management Planning |
Importance Rating: 3: Essential, 2: Important, 1: Somewhat Important |
|||||||
|
Question |
Capability Levels |
Capability |
Importance Rating |
Gap |
Weighted Gap |
|||
|
Desired |
Present |
|||||||
|
Asset Identification and Reporting |
|
|
|
|
|
|||
|
Does your council identify and record assets at the ‘component’ level for Transport Assets for valuation and depreciation purposes? |
1. No, assets
recorded at network level (eg road network) 4. Assets recorded at component planned within 12 mths 5. Yes, assets identified and recorded at component level. |
5.0 |
5.0 |
3.0 |
0.0 |
0.0 |
||
|
As above for Building |
1. No, assets recorded at category level
(eg all buildings) |
5.0 |
4.5 |
3.0 |
0.5 |
1.5 |
||
|
As above for Parks/Recreation Assets |
1. No, assets recorded at category level (eg all parks) |
5.0 |
4.5 |
3.0 |
0.5 |
1.5 |
||
|
As above for Drainage Assets |
1. No, assets recorded at category level |
5.0 |
4.5 |
2.0 |
0.5 |
1.0 |
||
|
Where is this asset data held? |
1. No asset register |
5.0 |
3.0 |
3.0 |
2.0 |
6.0 |
||
|
Question |
Capability Levels |
Capability |
Importance Rating |
Gap |
Weighted Gap |
|||
|
Desired |
Present |
|||||||
|
Asset Data Maintenance |
|
|
|
|
|
|
||
|
How current is your asset data? |
1. Asset register>5yrs out of date |
5.0 |
4.0 |
3.0 |
1.0 |
3.0 |
||
|
Does your council have a documented work procedure for asset register maintenance? |
1. No |
5.0 |
3.0 |
3.0 |
2.0 |
6.0 |
||
|
Does your council have a documented |
5.0 |
4.0 |
3.0 |
1.0 |
3.0 |
|||
|
Does your council have a documented |
4.0 |
1.0 |
2.0 |
3.0 |
6.0 |
|||
|
Has a council officer been allocated |
1. No |
4.0 |
2.0 |
2.0 |
2.0 |
4.0 |
||
|
Does the responsible council officer have the time and resources to maintain the asset register? |
1. No |
4.0 |
4.0 |
2.0 |
0.0 |
0.0 |
||
|
Asset Condition Data |
||||||||
|
Do you have condition data for |
1. No, no condition data |
5.0 |
4.0 |
2.0 |
1.0 |
2.0 |
||
|
As above for Building Assets |
4.0 |
4.0 |
2.0 |
0.0 |
0.0 |
|||
|
As above for Parks/Recreation Assets |
5.0 |
4.0 |
3.0 |
1.0 |
3.0 |
|||
|
As above for Drainage Assets |
1.0 |
1.0 |
1.0 |
0.0 |
0.0 |
|||
|
Question |
Capability Levels |
Capability |
Importance Rating |
Gap |
Weighted Gap |
|
|
Desired |
Present |
|||||
|
Risk Management |
|
|
|
|
|
|
|
Does your council have a current listing of asset related risks and risk management treatments linked to capital and maintenance programs for Transport Assets? |
1. No |
4.0 |
1.0 |
2.0 |
3.0 |
6.0 |
|
As above for Building Assets |
4.0 |
1.0 |
2.0 |
3.0 |
6.0 |
|
|
As above for Parks/Recreation Assets |
4.0 |
1.0 |
2.0 |
3.0 |
6.0 |
|
|
As above for Drainage Assets |
3.0 |
1.0 |
1.0 |
2.0 |
2.0 |
|
|
Relating Service Levels to Costs of Delivery |
|
|
|
|
|
|
|
Does your council know the life cycle costs of services provided using Transport Assets? |
1. No |
4.5 |
2.0 |
2.0 |
2.5 |
5.0 |
|
As above for Building Assets |
4.5 |
2.0 |
2.0 |
2.5 |
5.0 |
|
|
As above for Parks/Recreation Assets |
4.5 |
2.0 |
2.0 |
2.5 |
5.0 |
|
|
As above for Drainage Assets |
4.0 |
2.0 |
2.0 |
2.0 |
4.0 |
|
|
Future Demand Impacts |
|
|
|
|
|
|
|
Has your council identified future demands & impacts on service delivery for Transport Assets? |
1. No |
4.0 |
2.0 |
2.0 |
2.0 |
4.0 |
|
As above for Building Assets |
4.0 |
4.0 |
2.0 |
0.0 |
0.0 |
|
|
As above for Parks/Recreation Assets |
4.0 |
4.0 |
2.0 |
0.0 |
0.0 |
|
|
As above for Drainage Assets |
3.0 |
1.0 |
1.0 |
2.0 |
2.0 |
|
|
Asset Management Plans |
|
|
|
|
|
|
|
Has your council an adopted asset management plan for Transport Assets? |
1. No |
5.0 |
5.0 |
3.0 |
0.0 |
0.0 |
|
As above for Building Assets |
5.0 |
5.0 |
3.0 |
0.0 |
0.0 |
|
|
As above for Parks/Recreation Assets |
5.0 |
4.0 |
3.0 |
1.0 |
3.0 |
|
|
As above for Drainage Assets |
5.0 |
5.0 |
3.0 |
0.0 |
0.0 |
|
|
3. Gap Analysis – Financial Planning |
Importance Rating: 3: Essential, 2: Important, 1: Somewhat Important |
|||||||
|
Question |
Capability Levels |
Capability |
Importance Rating |
Gap |
Weighted Gap |
|||
|
Desired |
Present |
|||||||
|
Consideration of Life Cycle Costs in Investment Decisions |
||||||||
|
Does your council break up capital |
1. No |
5.0 |
3.0 |
2.0 |
2.0 |
4.0 |
||
|
Question |
Capability Levels |
Capability |
Importance Rating |
Gap |
Weighted Gap |
|||
|
Desired |
Present |
|||||||
|
Does your council receive and consider |
1. No |
5.0 |
3.0 |
2.0 |
2.0 |
4.0 |
||
|
Revaluation Process |
||||||||
|
How does your council do its asset revaluations for infrastructure assets (other than buildings)? |
1. Values held at ‘cost’. No revaluations |
4.0 |
1.0 |
3.0 |
3.0 |
9.0 |
||
|
What is your council’s revaluation frequency for assets? |
1. Values held at ‘cost’. No revaluations |
3.0 |
1.0 |
2.0 |
2.0 |
4.0 |
||
|
Reporting Asset Consumption Against Service Delivery |
||||||||
|
Does your council report asset consumption as an
operating expense against the relevant |
1. No, reported as corporate overhead expense |
5.0 |
4.0 |
3.0 |
1.0 |
3.0 |
||
|
Long Term Financial Plans |
||||||||
|
What is the length of your council’s long term financial plan? |
1. 1 year |
4.0 |
4.0 |
3.0 |
0.0 |
0.0 |
||
|
Question |
Capability Levels |
Capability |
Importance Rating |
Gap |
Weighted Gap |
|||
|
Desired |
Present |
|||||||
|
Long Term Financial Plans Include Projected Asset Renewals (Not Depreciation) |
||||||||
|
Does your council’s LTFP include asset renewals? |
1. No |
5.0 |
4.0 |
3.0 |
1.0 |
3.0 |
||
|
Long Term Financial Plans Include Growth and Upgrade of Services |
||||||||
|
Does your council’s |
1. No |
5.0 |
4.0 |
3.0 |
1.0 |
3.0 |
||
|
Long Term Financial Plans Include Life Cycle Costs for New Assets and Services |
||||||||
|
Does your council’s LTFP include provision for future operating expenses associated with new assets and services? |
1. No |
5.0 |
3.0 |
3.0 |
2.0 |
6.0 |
||
APPENDIX E : Asset Management Process Improvement Plan Template
|
Process |
Responsibility |
Year 1 |
Year 2 |
Year 3 |
|||||||||
|
|
|
Q1 |
Q2 |
Q3 |
Q4 |
Q1 |
Q2 |
Q3 |
Q4 |
Q1 |
Q2 |
Q3 |
Q4 |
|
1. Asset Management Organisation |
|
|
|
|
|
|
|
|
|
|
|
|
|
|
1.1. Establish AM structure & framework |
|
|
|
|
|
|
|
|
|
|
|
|
|
|
1.2. Define formal roles & responsibilities |
|
|
|
|
|
|
|
|
|
|
|
|
|
|
1.3. Identify internal & external customers and stakeholders |
|
|
|
|
|
|
|
|
|
|
|
|
|
|
1.4. Capacity, capability & skills |
|
|
|
|
|
|
|
|
|
|
|
|
|
|
· Define required AM resources |
|
|
|
|
|
|
|
|
|
|
|
|
|
|
· Assess and build matrix of existing capacity, capability & skills |
|
|
|
|
|
|
|
|
|
|
|
|
|
|
· Analyse gaps required for good asset management process and to progress along the AM maturity curve to Advanced status by 31/12/15 |
|
|
|
|
|
|
|
|
|
|
|
|
|
|
· Develop training & development programs |
|
|
|
|
|
|
|
|
|
|
|
|
|
|
· Develop AM communications strategy for AM culture |
|
|
|
|
|
|
|
|
|
|
|
|
|
|
2. Development of Asset Management Strategies and Plans |
|
|
|
|
|
|
|
|
|
|
|
|
|
|
2.1. Link with CBP |
|
|
|
|
|
|
|
|
|
|
|
|
|
|
· Identify the vision and 10-year business goals & objectives |
|
|
|
|
|
|
|
|
|
|
|
|
|
|
· Identify business/service drivers & service models for each directorate |
|
|
|
|
|
|
|
|
|
|
|
|
|
|
2.2. Link with LTFP |
|
|
|
|
|
|
|
|
|
|
|
|
|
|
· The financial context |
|
|
|
|
|
|
|
|
|
|
|
|
|
|
· Asset financial constraints |
|
|
|
|
|
|
|
|
|
|
|
|
|
|
· Financial ratios (see section 3.1) |
|
|
|
|
|
|
|
|
|
|
|
|
|
|
· Annual budgets for assets |
|
|
|
|
|
|
|
|
|
|
|
|
|
|
· 10-year expenditure plan (renewal, upgrade & new) (see section 2.9) |
|
|
|
|
|
|
|
|
|
|
|
|
|
|
2.3. Define asset categories/classes |
|
|
|
|
|
|
|
|
|
|
|
|
|
|
2.4. Identify significant & critical assets |
|
|
|
|
|
|
|
|
|
|
|
|
|
|
2.5. Define desired asset base in 10 years, incl. Accommodation Plan |
|
|
|
|
|
|
|
|
|
|
|
|
|
|
2.6. Define critical success factors for each asset category (see section 3) |
|
|
|
|
|
|
|
|
|
|
|
|
|
|
2.7. Review existing asset base & undertake detailed condition assessments for significant and critical assets |
|
|
|
|
|
|
|
|
|
|
|
|
|
|
2.8. Analyse gaps |
|
|
|
|
|
|
|
|
|
|
|
|
|
|
2.9. Develop asset strategies to close the gaps (capital, maintenance, accommodation, disposal & acquisition) |
|
|
|
|
|
|
|
|
|
|
|
|
|
|
2.10. Prioritise projects against criticality and financial context/constraints |
|
|
|
|
|
|
|
|
|
|
|
|
|
|
3. Develop Individual Asset Plans (from strategy) |
|
|
|
|
|
|
|
|
|
|
|
|
|
|
3.1. Maintenance, renewal, upgrade, disposal |
|
|
|
|
|
|
|
|
|
|
|
|
|
|
3.2. Annual operating plans & budgets |
|
|
|
|
|
|
|
|
|
|
|
|
|
|
3.3. 5 – 10 year plans |
|
|
|
|
|
|
|
|
|
|
|
|
|
|
4. Performance Measurement |
|
|
|
|
|
|
|
|
|
|
|
|
|
|
4.1. Satisfy ratios for: |
|
|
|
|
|
|
|
|
|
|
|
|
|
|
· Asset Consumption (ACR) |
|
|
|
|
|
|
|
|
|
|
|
|
|
|
· Asset Sustainability (ASR) |
|
|
|
|
|
|
|
|
|
|
|
|
|
|
· Asset Renewal Funding (ARF) |
|
|
|
|
|
|
|
|
|
|
|
|
|
|
4.2. Set objectives for: |
|
|
|
|
|
|
|
|
|
|
|
|
|
|
· The AM system |
|
|
|
|
|
|
|
|
|
|
|
|
|
|
· AM Strategy |
|
|
|
|
|
|
|
|
|
|
|
|
|
|
· Asset performance: effectiveness (location, suitability, condition, amenity, functionality, utilisation) |
|
|
|
|
|
|
|
|
|
|
|
|
|
|
· Asset performance: efficiency (life cycle cost, cost-in-use, value-for-money) |
|
|
|
|
|
|
|
|
|
|
|
|
|
|
· Operational & maintenance management: maintenance spend, portfolio condition, effectiveness of spend |
|
|
|
|
|
|
|
|
|
|
|
|
|
|
· Levels of service for internal & external clients (community, technical, compliance, internal) |
|
|
|
|
|
|
|
|
|
|
|
|
|
|
· Outsource service providers, suppliers & contractors |
|
|
|
|
|
|
|
|
|
|
|
|
|
|
4.3. Agree KPIs relevant to objectives |
|
|
|
|
|
|
|
|
|
|
|
|
|
|
4.4. Define units of measurement |
|
|
|
|
|
|
|
|
|
|
|
|
|
|
4.5. Develop measurement tools and techniques |
|
|
|
|
|
|
|
|
|
|
|
|
|
|
4.6. Benchmark performance |
|
|
|
|
|
|
|
|
|
|
|
|
|
|
4.7. Develop a quality management system (performance reviews) |
|
|
|
|
|
|
|
|
|
|
|
|
|
|
4.8. Develop reporting regime relevant to all organisational levels, including a balanced scorecard. |
|
|
|
|
|
|
|
|
|
|
|
|
|
|
5. Data & Systems |
|
|
|
|
|
|
|
|
|
|
|
|
|
|
5.1. Asset inventory & information |
|
|
|
|
|
|
|
|
|
|
|
|
|
|
· Complete, check, verify & cleanse database |
|
|
|
|
|
|
|
|
|
|
|
|
|
|
· Develop process for ongoing management & maintenance of database |
|
|
|
|
|
|
|
|
|
|
|
|
|
|
5.2. Develop common corporate framework based on asset hierarchy |
|
|
|
|
|
|
|
|
|
|
|
|
|
|
5.3. Review account structure & finance system for sufficient componentisation to enable required level of financial reporting on assets |
|
|
|
|
|
|
|
|
|
|
|
|
|
|
5.4. Develop database of unit rates for asset maintenance & renewal |
|
|
|
|
|
|
|
|
|
|
|
|
|
|
5.5. Select/acquire asset management software that interfaces with the Finance Management System and ROMAN II. Key functionality requirements: |
|
|
|
|
|
|
|
|
|
|
|
|
|
|
· Hold details of all assets in at least the level of detail of the recently-built database |
|
|
|
|
|
|
|
|
|
|
|
|
|
|
· Store, maintain and update asset condition reports and defect conditions |
|
|
|
|
|
|
|
|
|
|
|
|
|
|
· Plan and long-term operation, maintenance, renewal and upgrade of assets; forward capital works programs; maintenance programs and works |
|
|
|
|
|
|
|
|
|
|
|
|
|
|
· Develop Financial management & performance reports |
|
|
|
|
|
|
|
|
|
|
|
|
|
|
· Required reporting criteria |
|
|
|
|
|
|
|
|
|
|
|
|
|
|
· Property & facility management functionality |
|
|
|
|
|
|
|
|
|
|
|
|
|
|
6. Translation of Strategy & Plans into Asset Programs |
|
|
|
|
|
|
|
|
|
|
|
|
|
|
Develop and document processes for |
|
|
|
|
|
|
|
|
|
|
|
|
|
|
6.1. Identification of potential projects |
|
|
|
|
|
|
|
|
|
|
|
|
|
|
6.2. Preparation of Business cases |
|
|
|
|
|
|
|
|
|
|
|
|
|
|
6.3. Asset program development and evaluation |
|
|
|
|
|
|
|
|
|
|
|
|
|
|
6.4. Financial planning for assets |
|
|
|
|
|
|
|
|
|
|
|
|
|
|
7. Delivery of Asset Programs |
|
|
|
|
|
|
|
|
|
|
|
|
|
|
Develop and document processes to: |
|
|
|
|
|
|
|
|
|
|
|
|
|
|
7.1. Assess optimum means of delivery |
|
|
|
|
|
|
|
|
|
|
|
|
|
|
7.2. Design project structures and governance |
|
|
|
|
|
|
|
|
|
|
|
|
|
|
7.3. Prepare project management plans |
|
|
|
|
|
|
|
|
|
|
|
|
|
|
7.4. Communicate to stakeholders |
|
|
|
|
|
|
|
|
|
|
|
|
|
|
7.5. Measure project performance |
|
|
|
|
|
|
|
|
|
|
|
|
|
|
7.6. Manage risk |
|
|
|
|
|
|
|
|
|
|
|
|
|
|
8. Risk Management |
|
|
|
|
|
|
|
|
|
|
|
|
|
|
Design and document a risk management system for each asset category and significant & critical assets that: |
|
|
|
|
|
|
|
|
|
|
|
|
|
|
8.1. Conforms to the CBP requirements for management of risk |
|
|
|
|
|
|
|
|
|
|
|
|
|
|
8.2. Includes contingency and continuity plans for significant and critical assets |
|
|
|
|
|
|
|
|
|
|
|
|
|
|
9. Continuous Improvement |
|
|
|
|
|
|
|
|
|
|
|
|
|
|
Develop and document procedures for: |
|
|
|
|
|
|
|
|
|
|
|
|
|
|
9.1. Reviewing and updating the Asset Management Strategy and Asset Management Plan |
|
|
|
|
|
|
|
|
|
|
|
|
|
|
9.2. A methodology for assessing remaining useful lives of asset groups, residual values and componentised depreciation |
|
|
|
|
|
|
|
|
|
|
|
|
|
|
9.3. A methodology to collect and record asset data |
|
|
|
|
|
|
|
|
|
|
|
|
|
|
9.4. A process for the handover of assets to asset custodians |
|
|
|
|
|
|
|
|
|
|
|
|
|
|
9.5. A process to communicate the implications of asset management plans to internal and external stakeholders |
|
|
|
|
|
|
|
|
|
|
|
|
|
|
9.6. Reviewing and improving: |
|
|
|
|
|
|
|
|
|
|
|
|
|
|
· The asset management system and process |
|
|
|
|
|
|
|
|
|
|
|
|
|
|
· Corporate structure |
|
|
|
|
|
|
|
|
|
|
|
|
|
|
· Delivery models |
|
|
|
|
|
|
|
|
|
|
|
|
|
|
· Skills, capability & capacity |
|
|
|
|
|
|
|
|
|
|
|
|
|
|
· Asset performance |
|
|
|
|
|
|
|
|
|
|
|
|
|
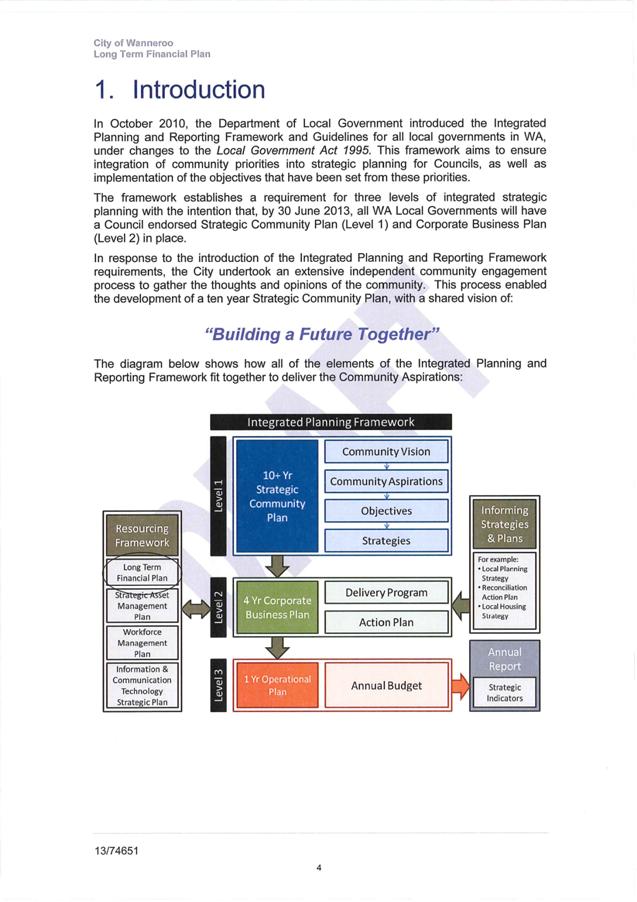
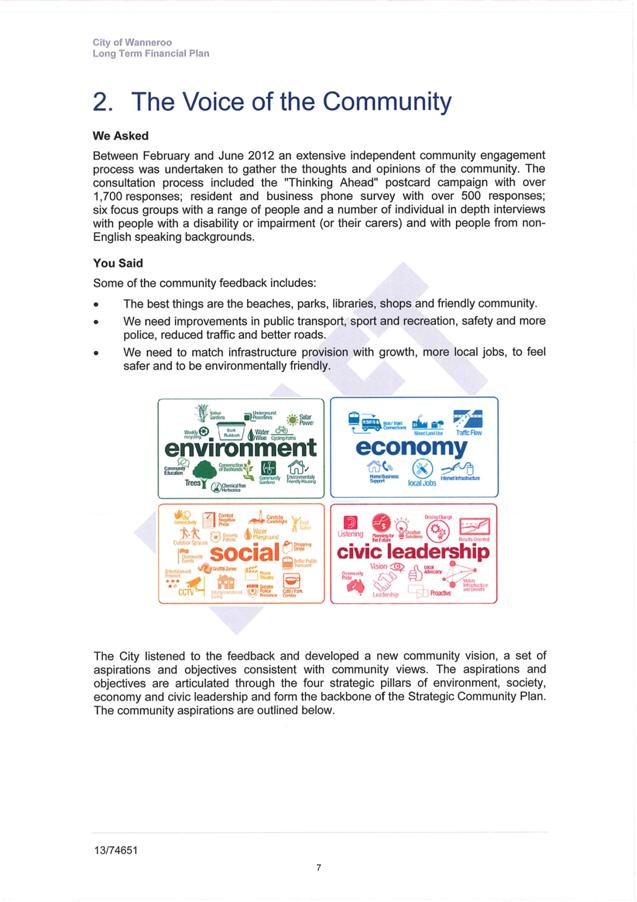
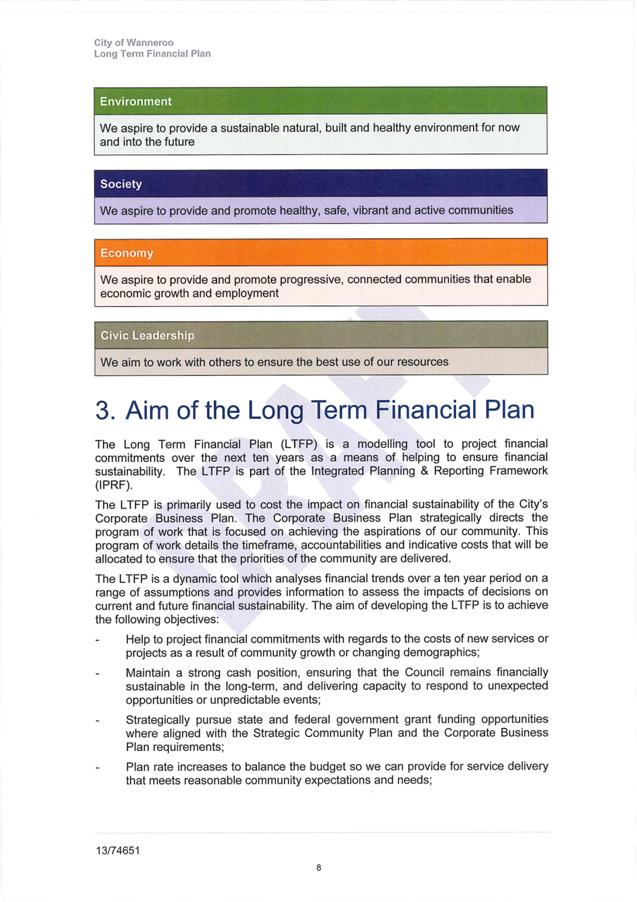
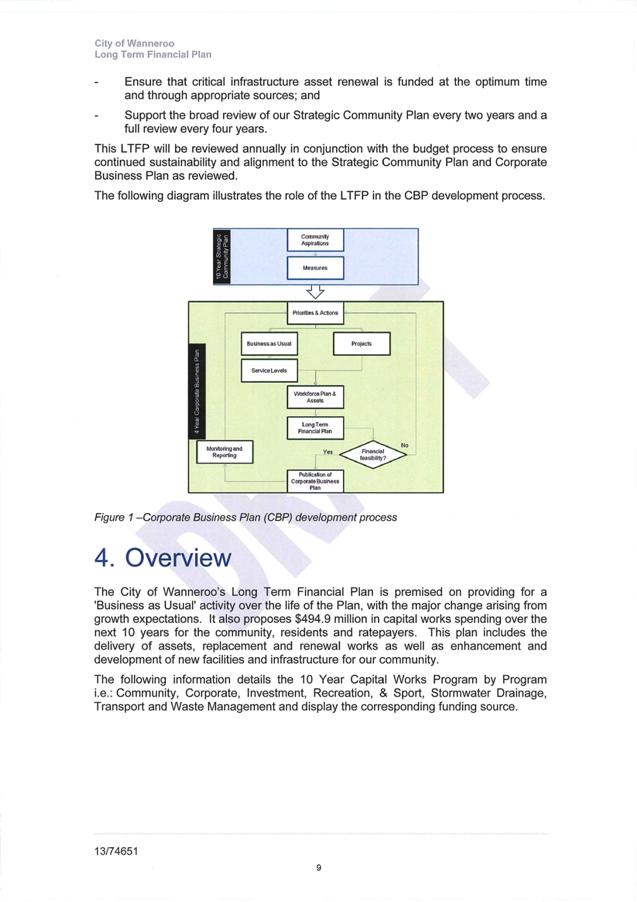
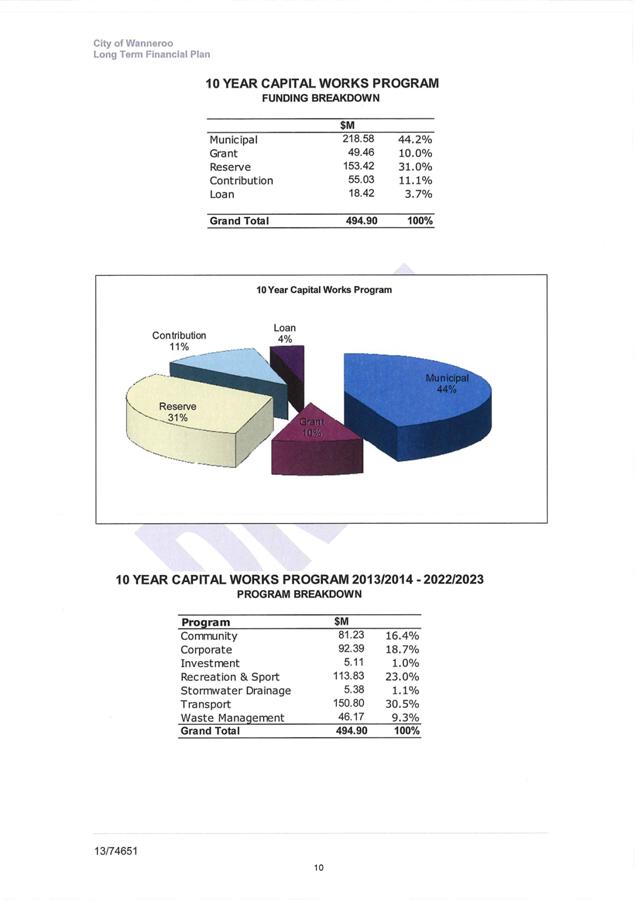
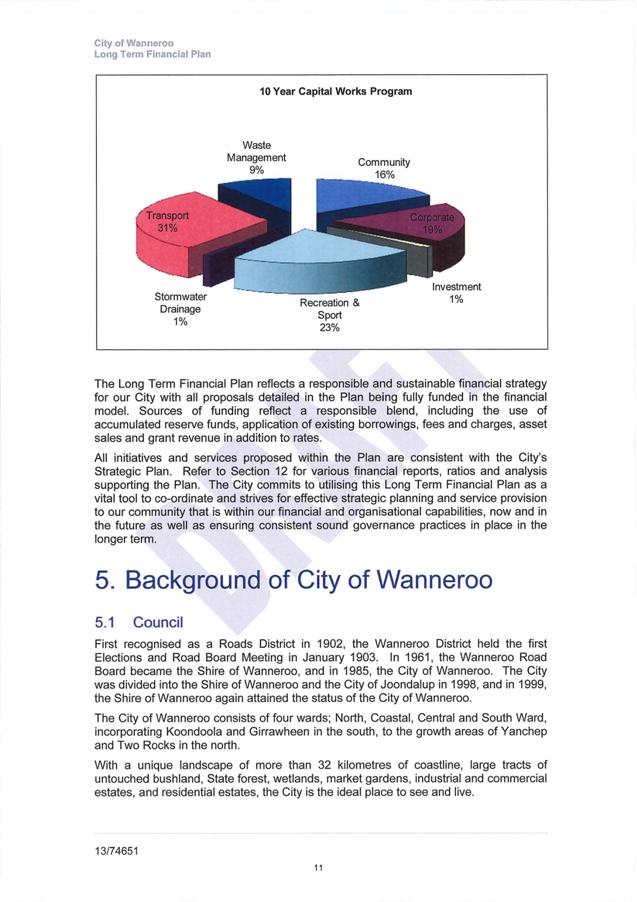
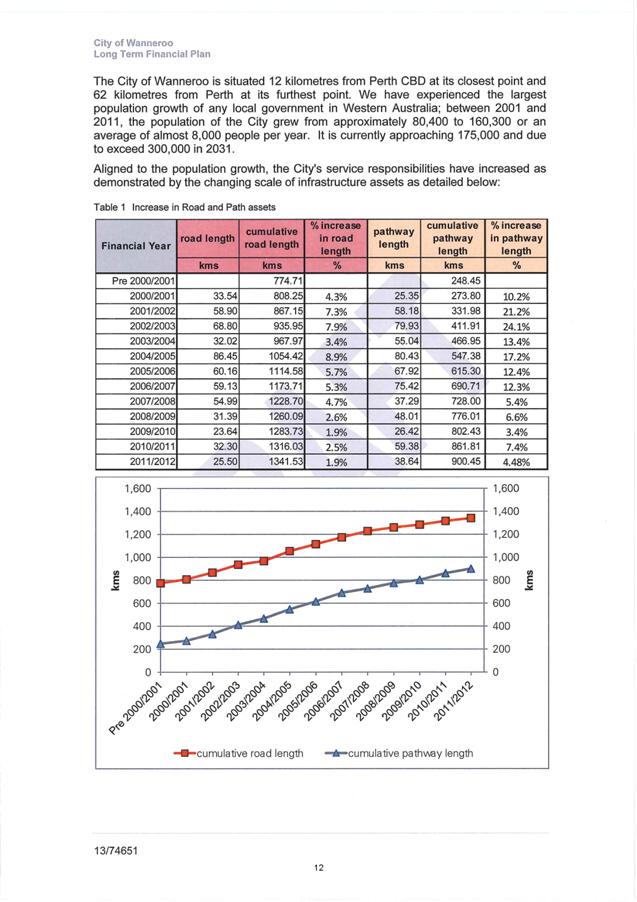
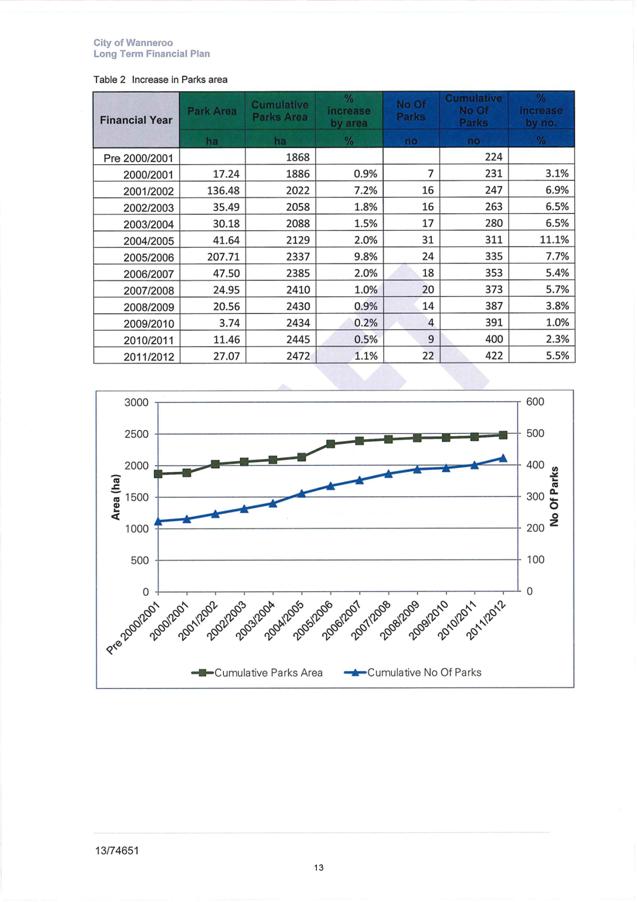
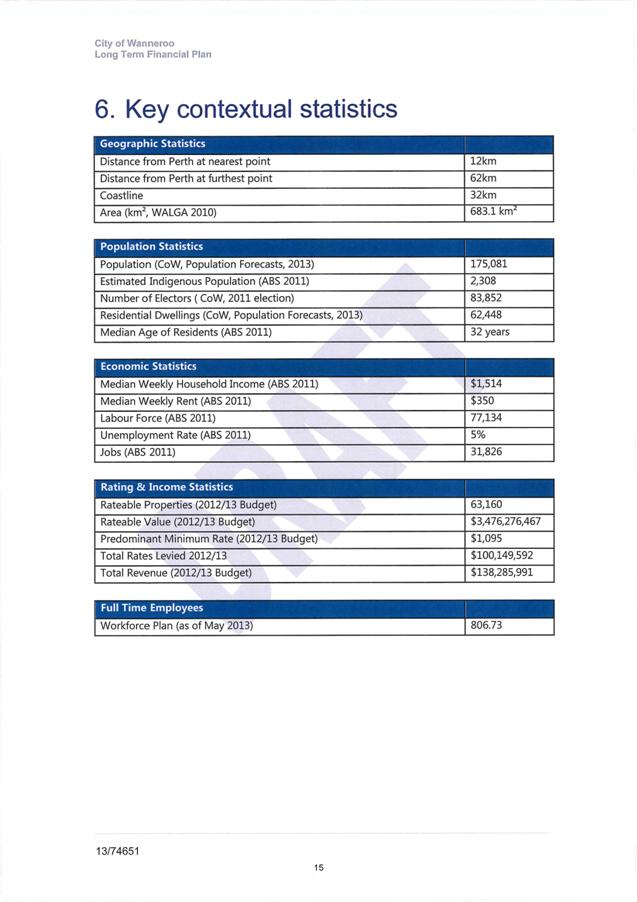
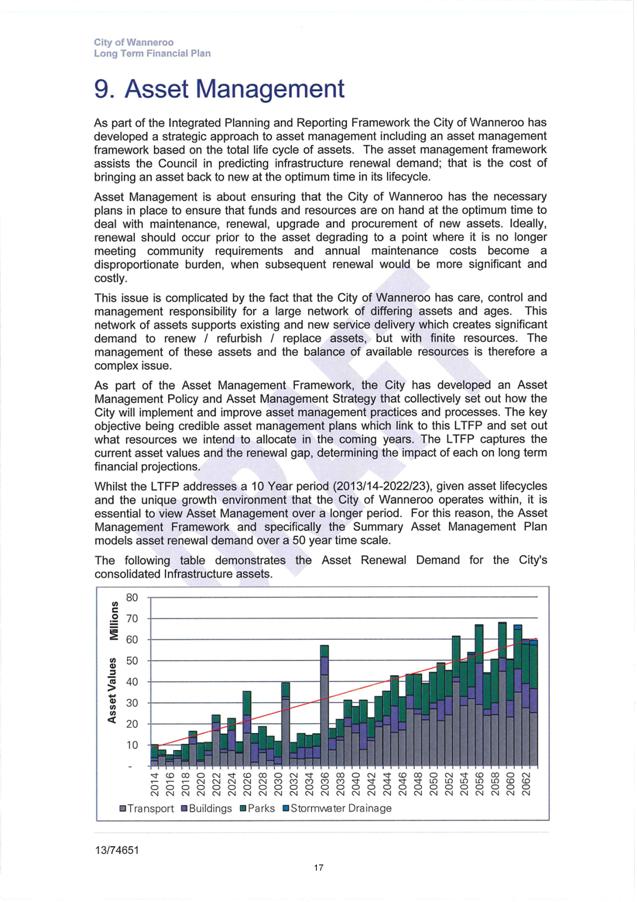
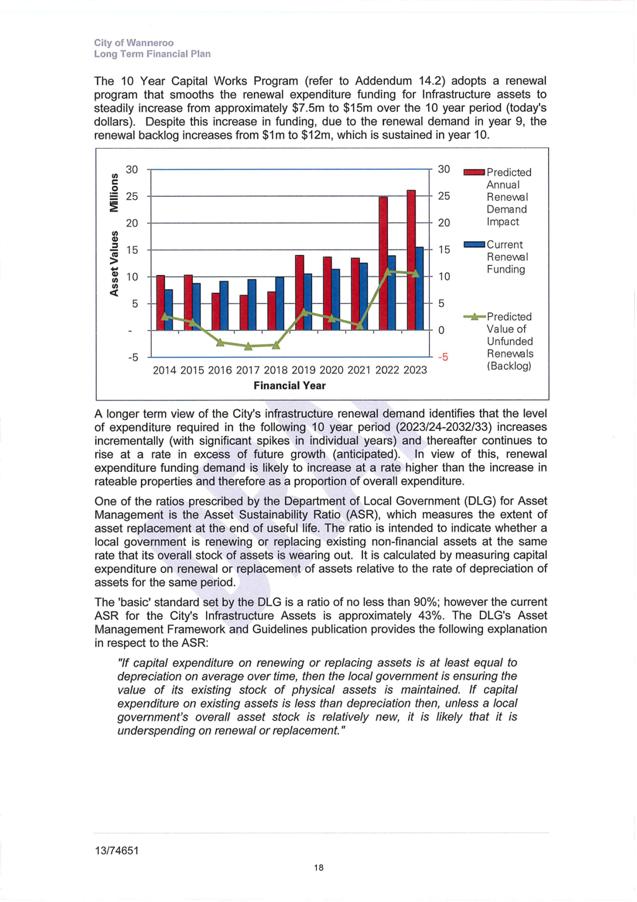
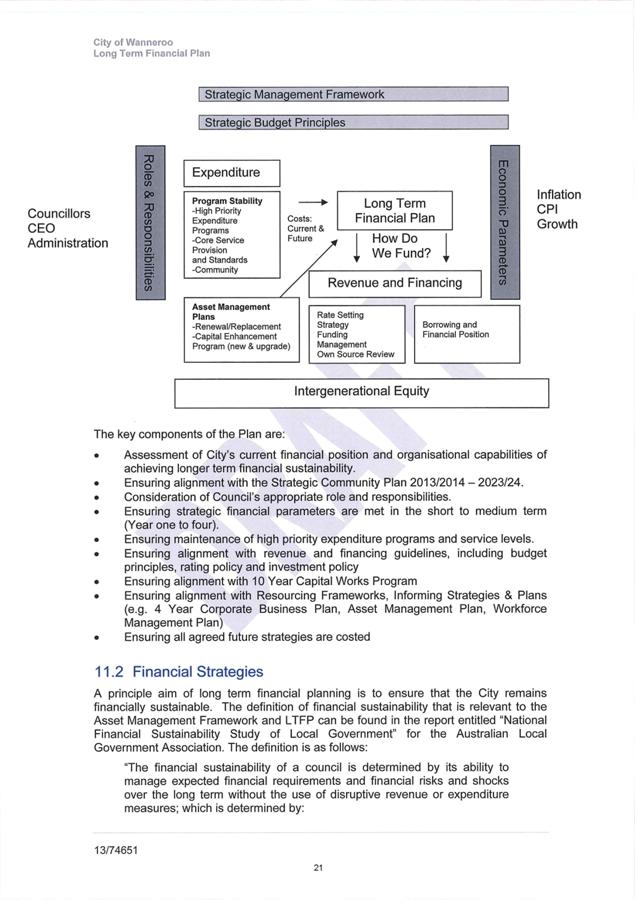
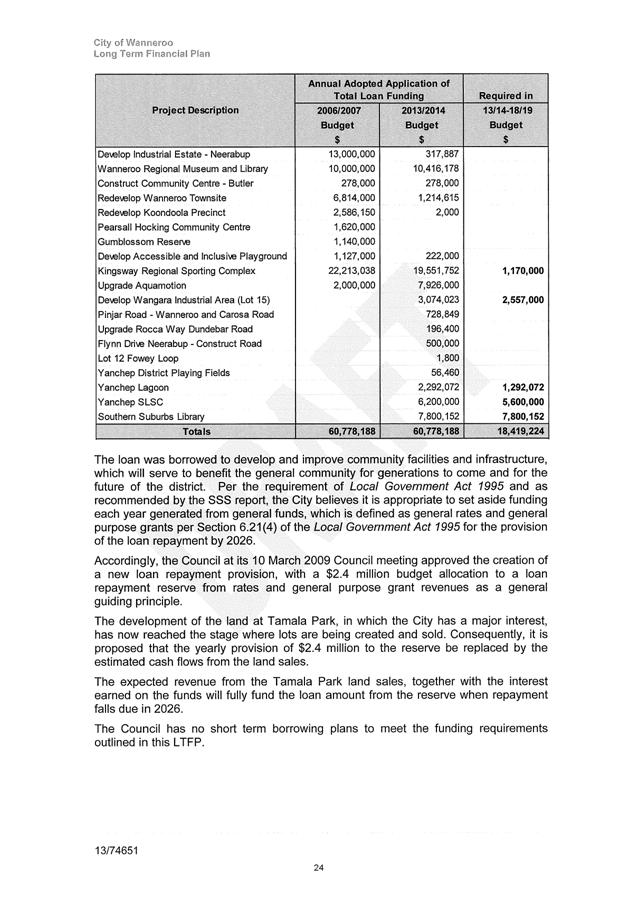
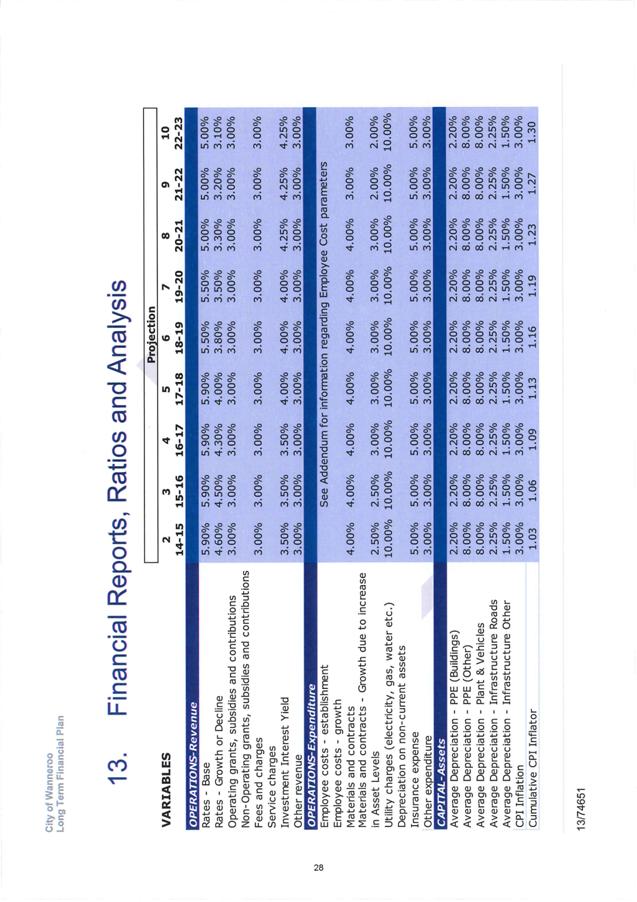

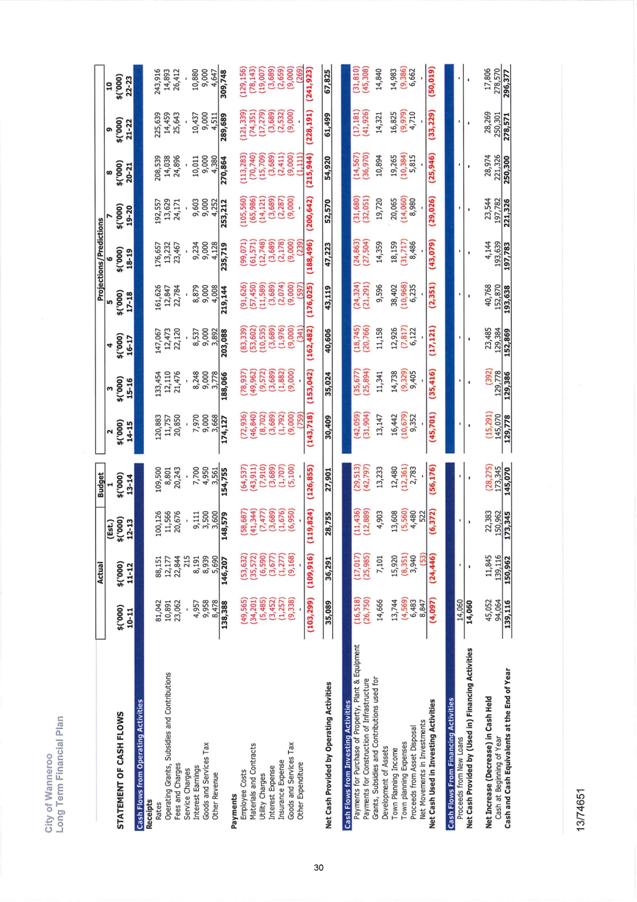
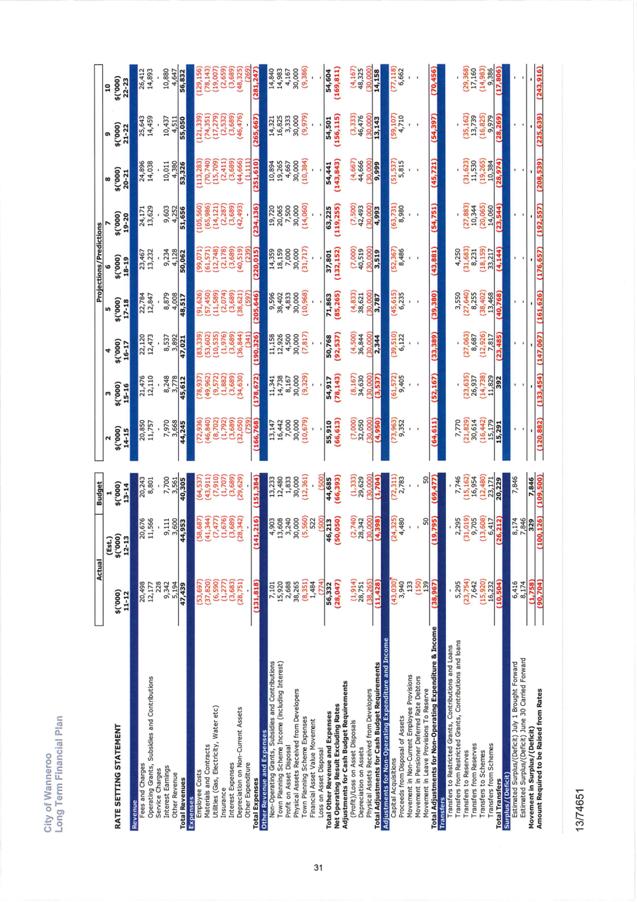
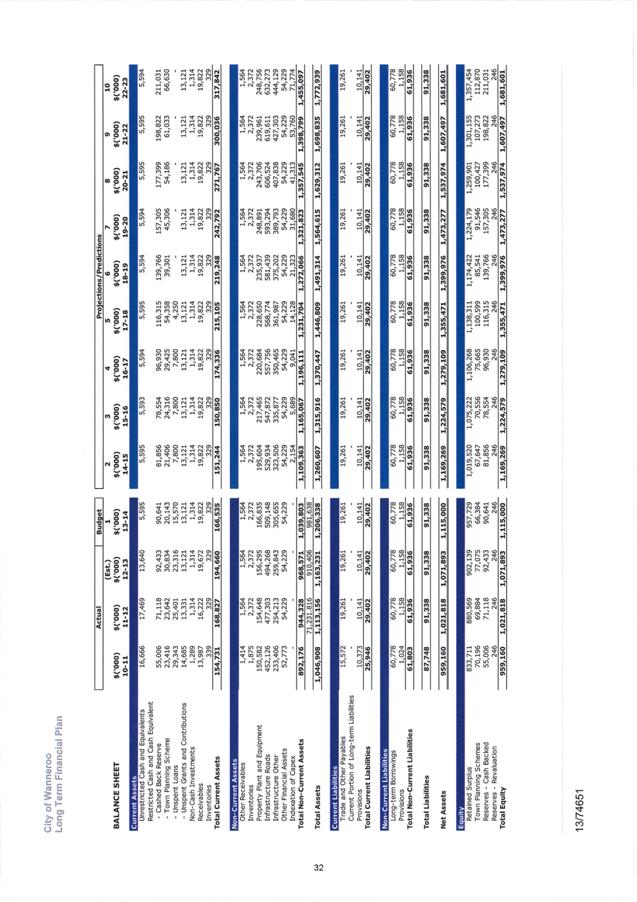
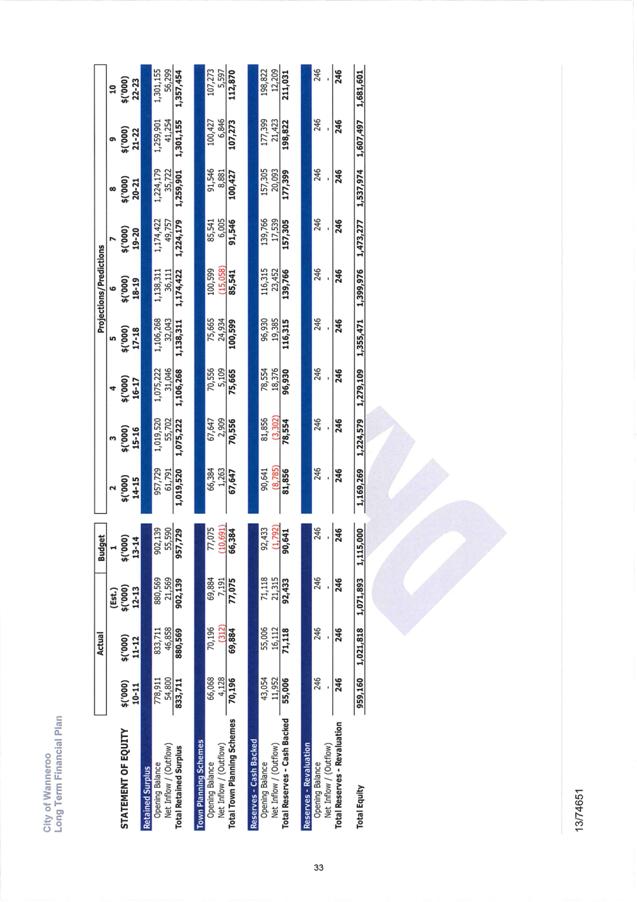
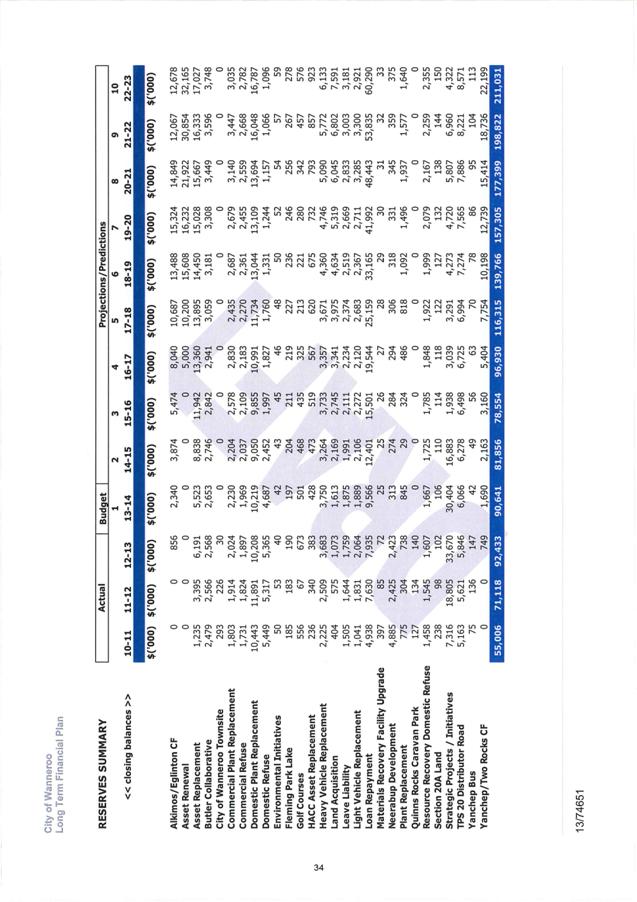
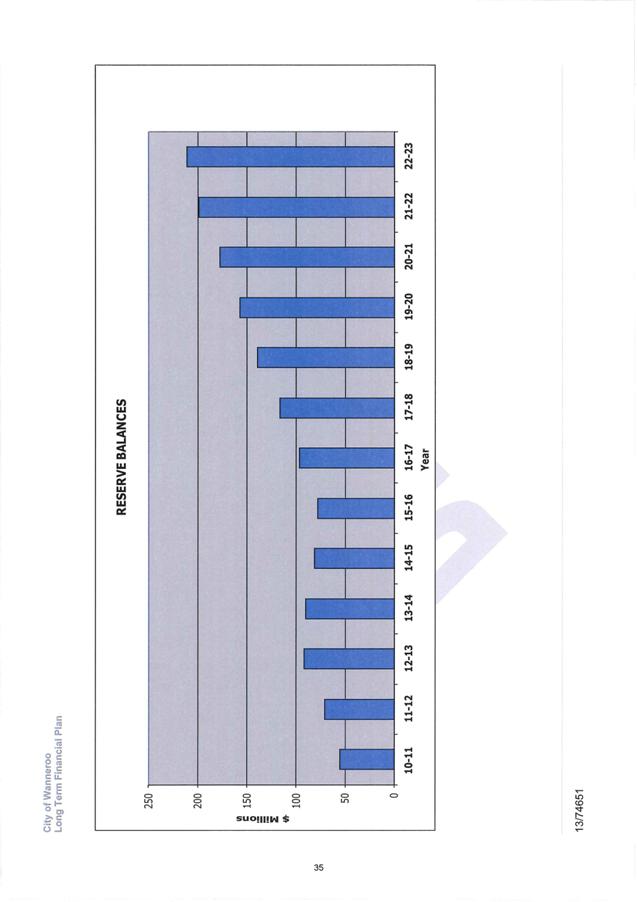
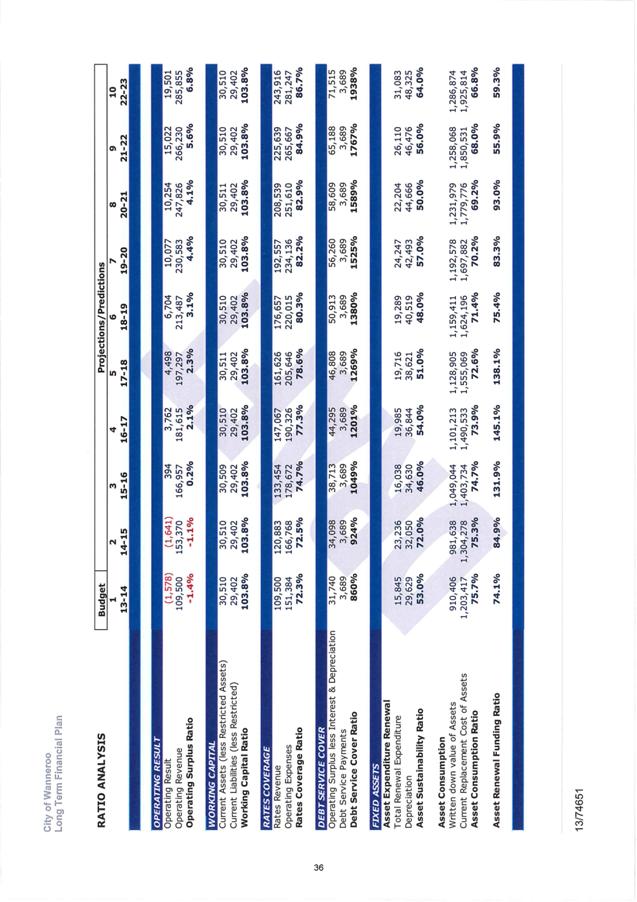
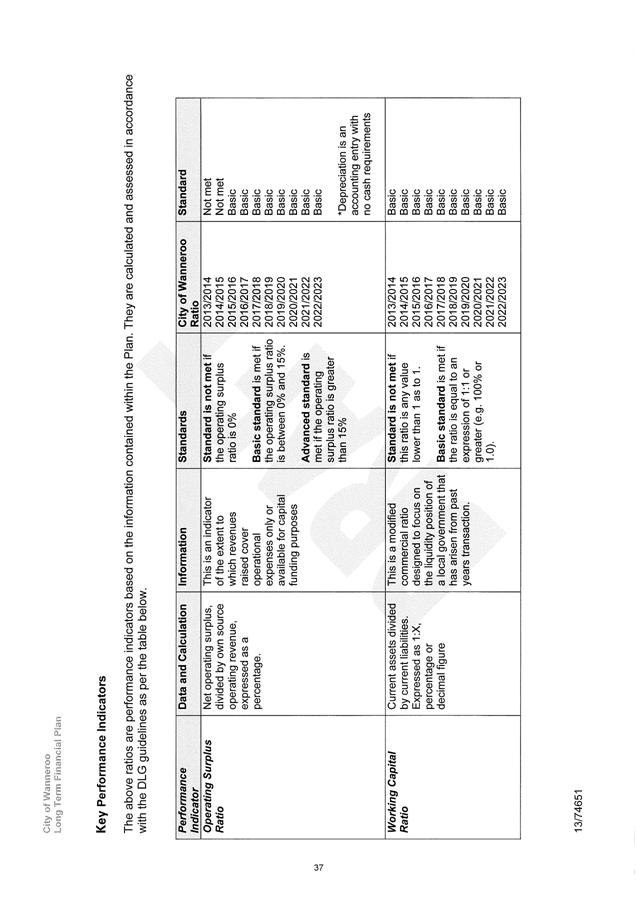
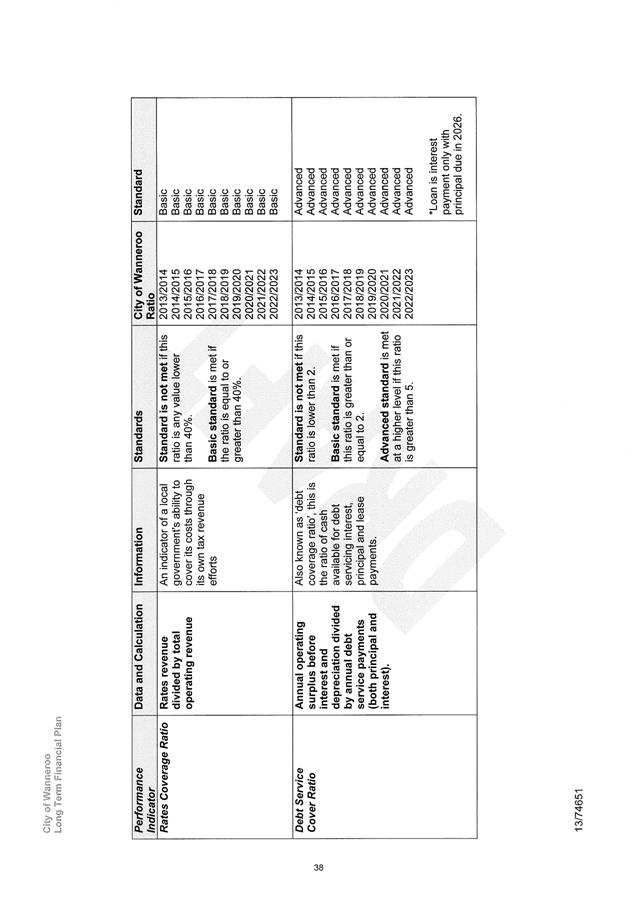
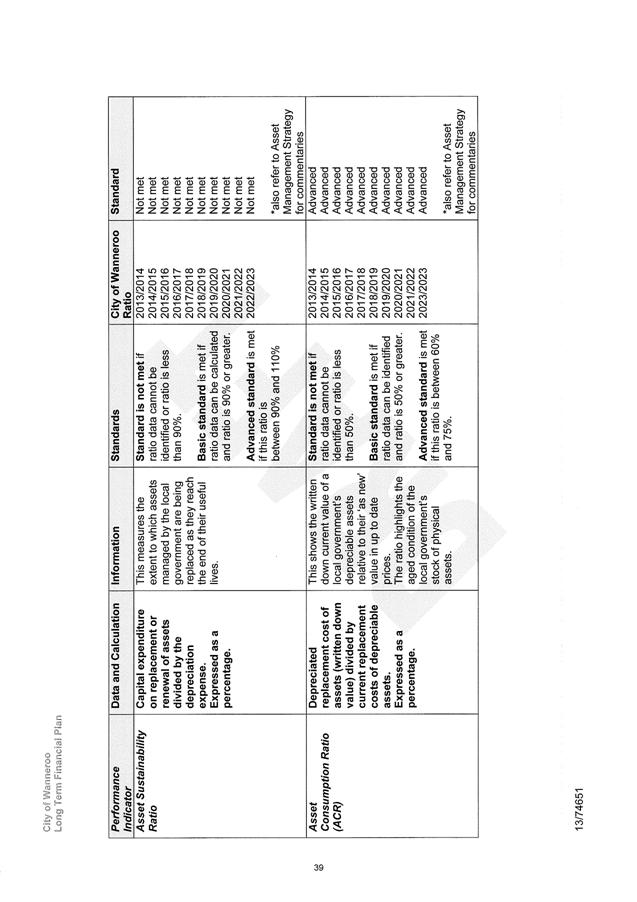
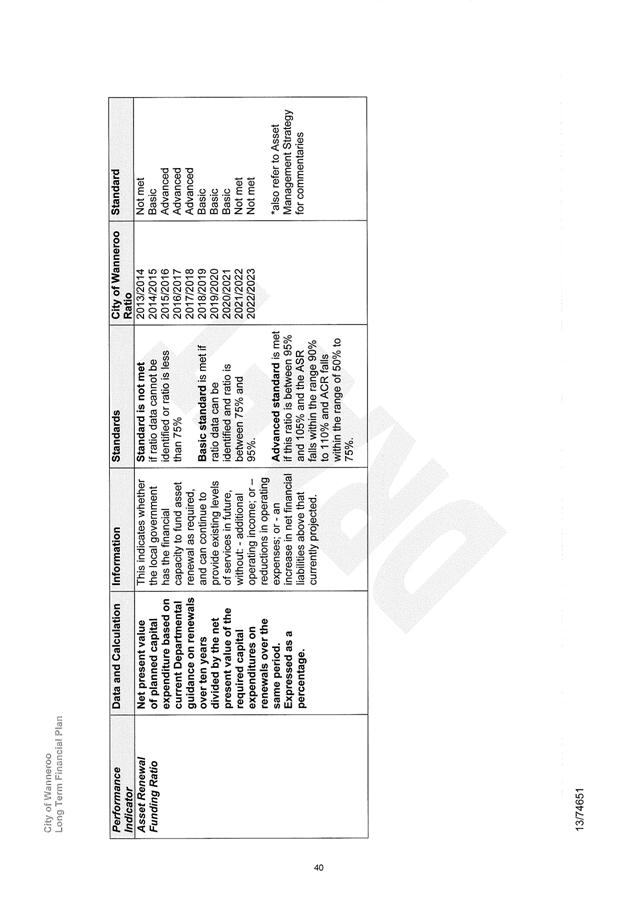
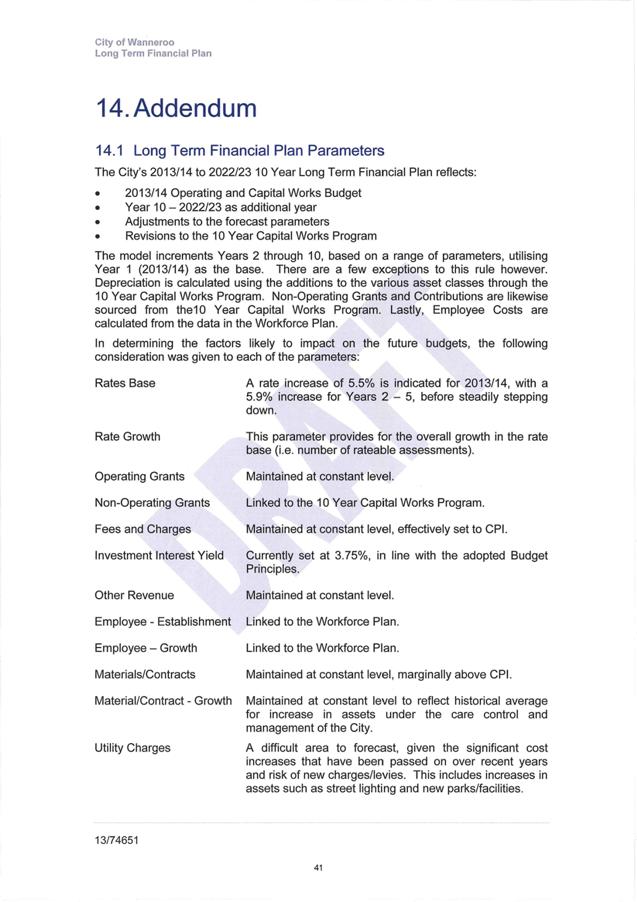
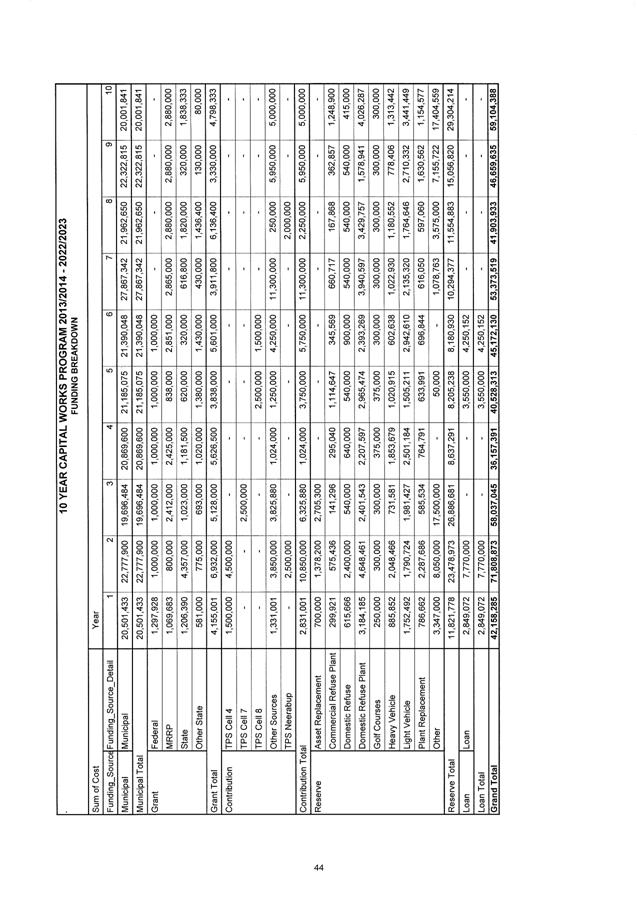
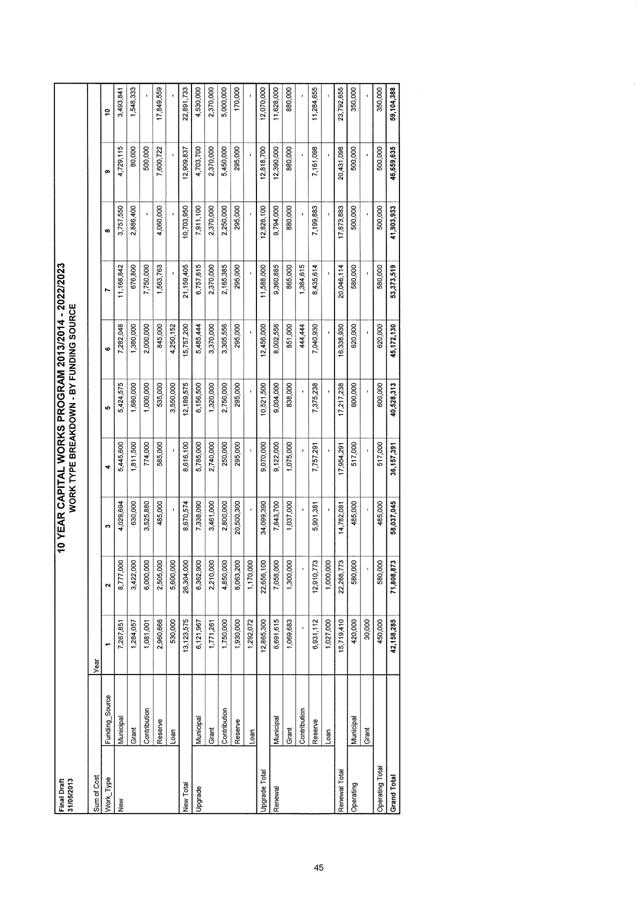
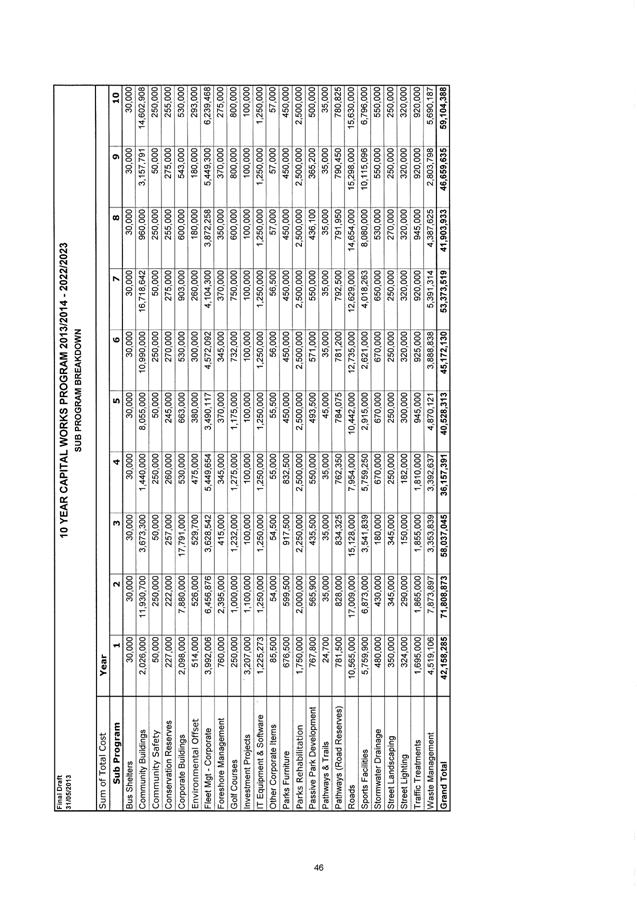
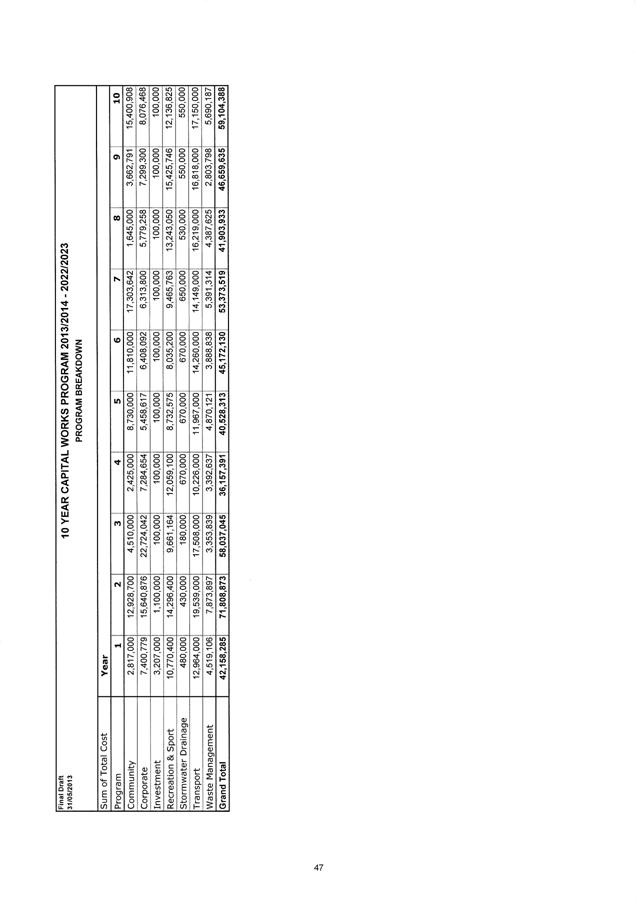
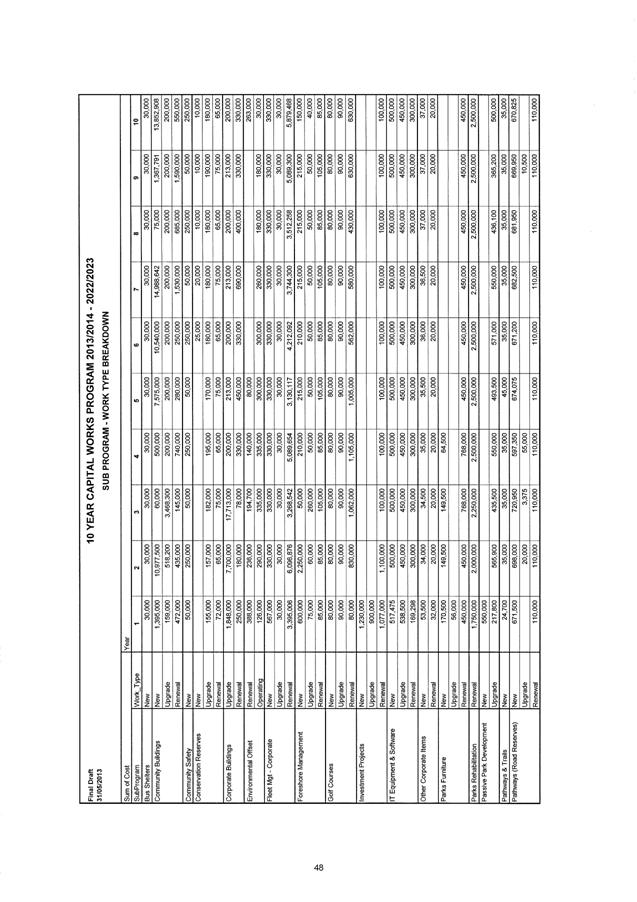
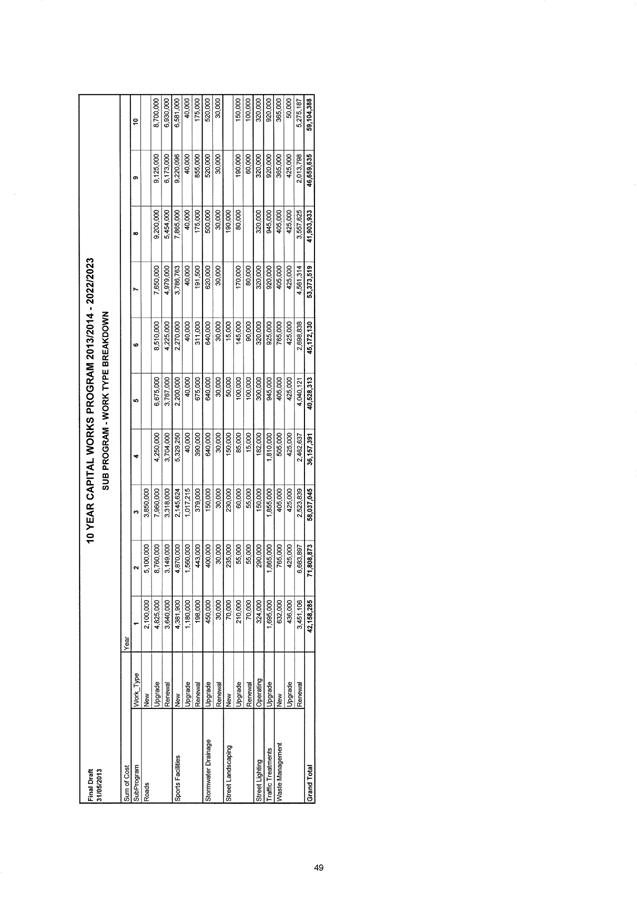
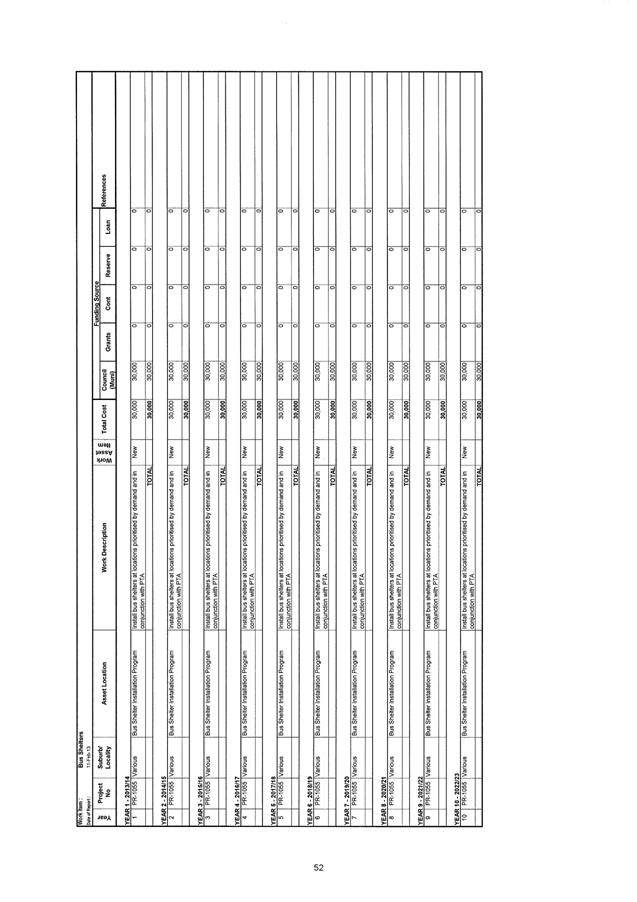
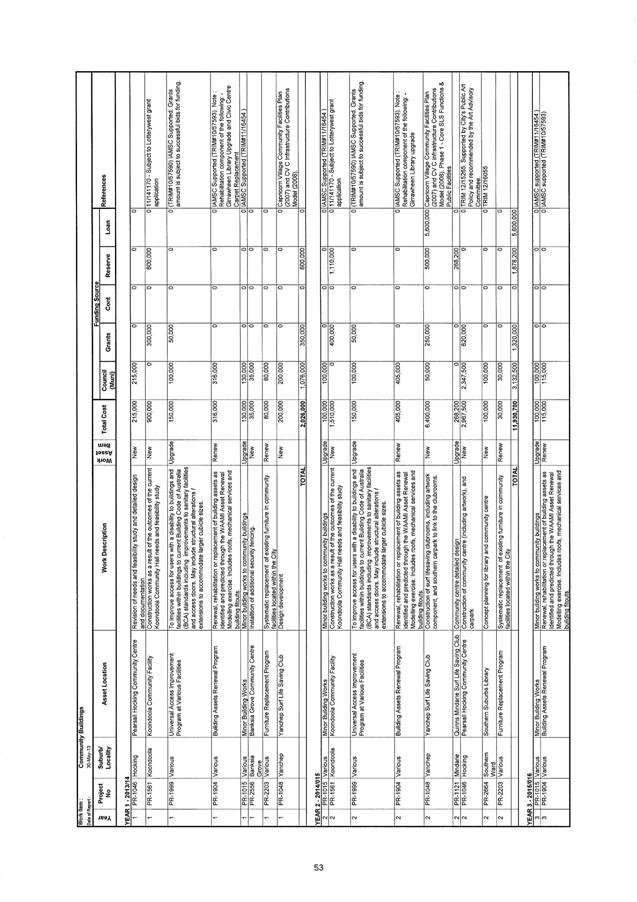
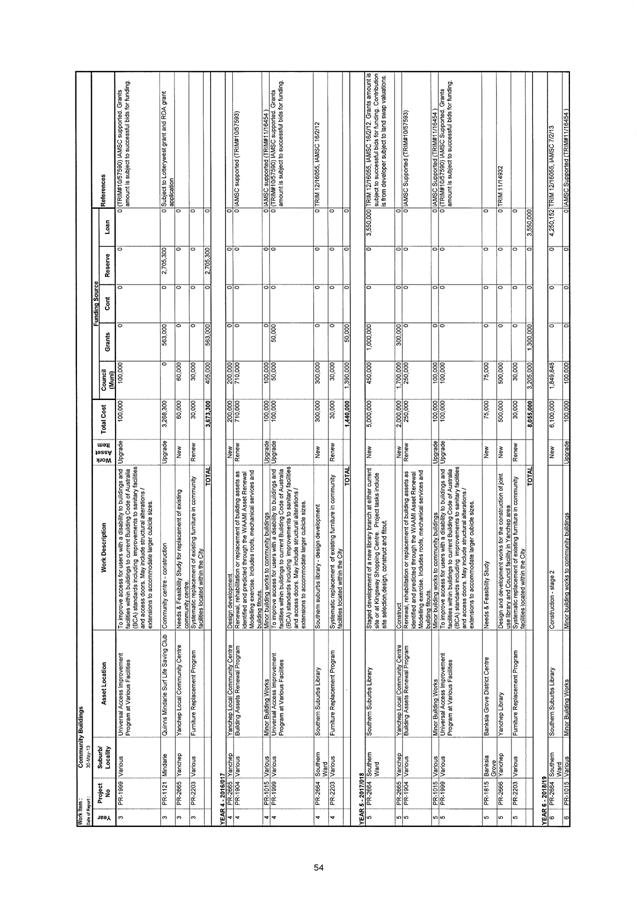
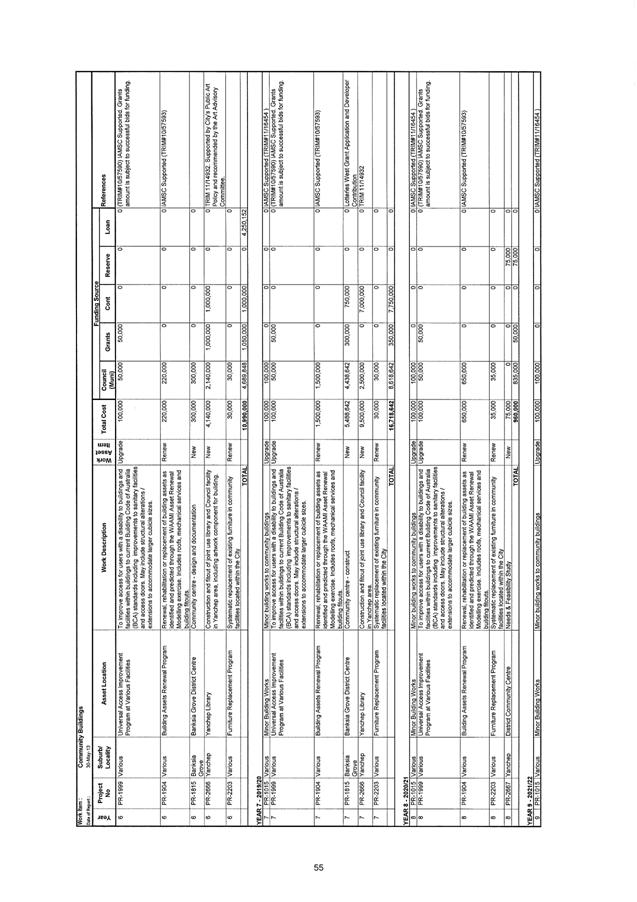
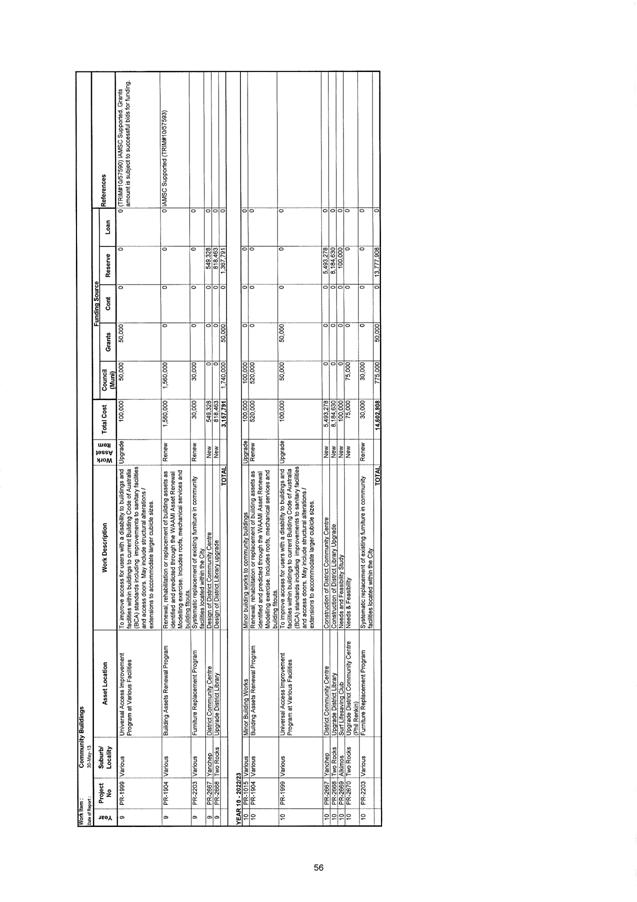
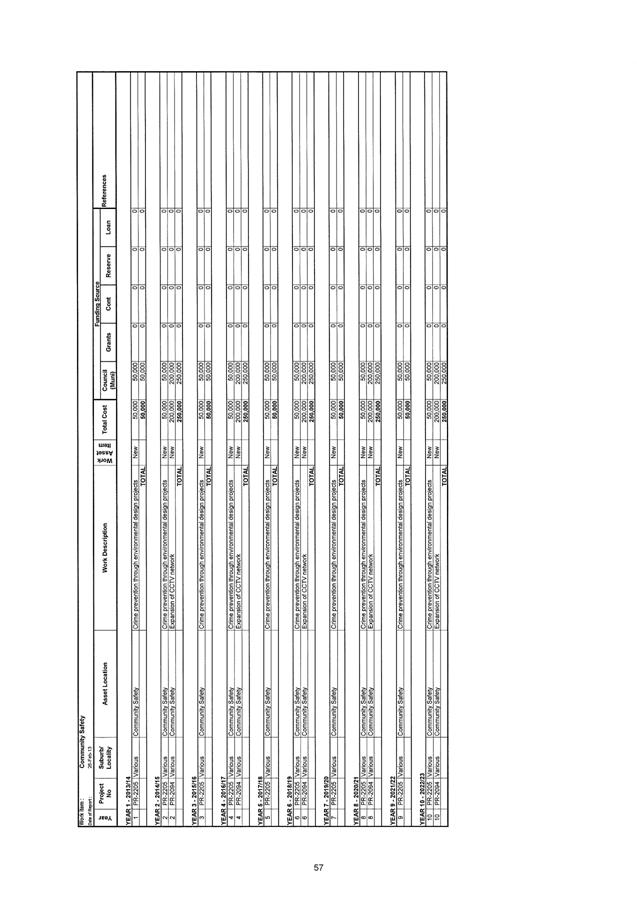
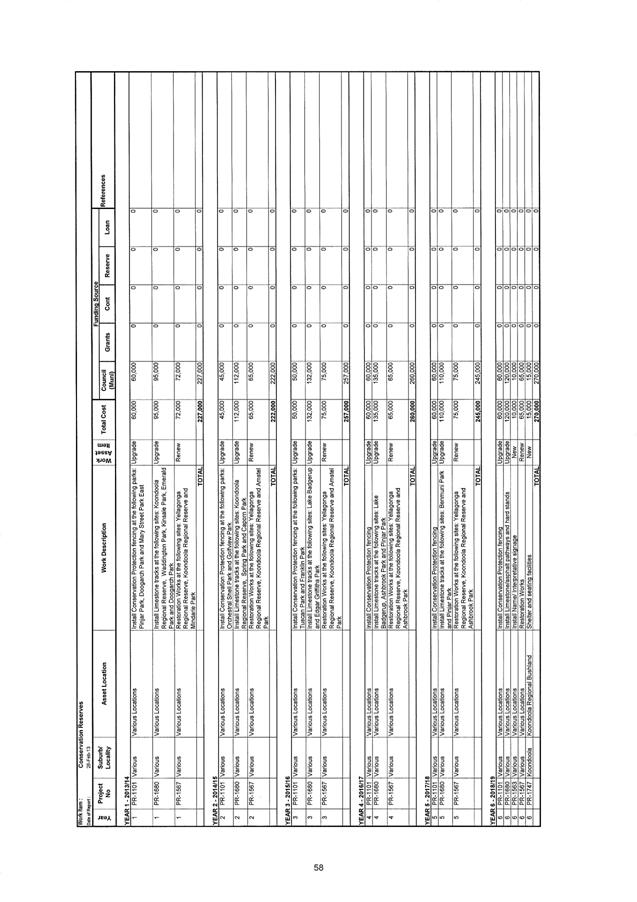

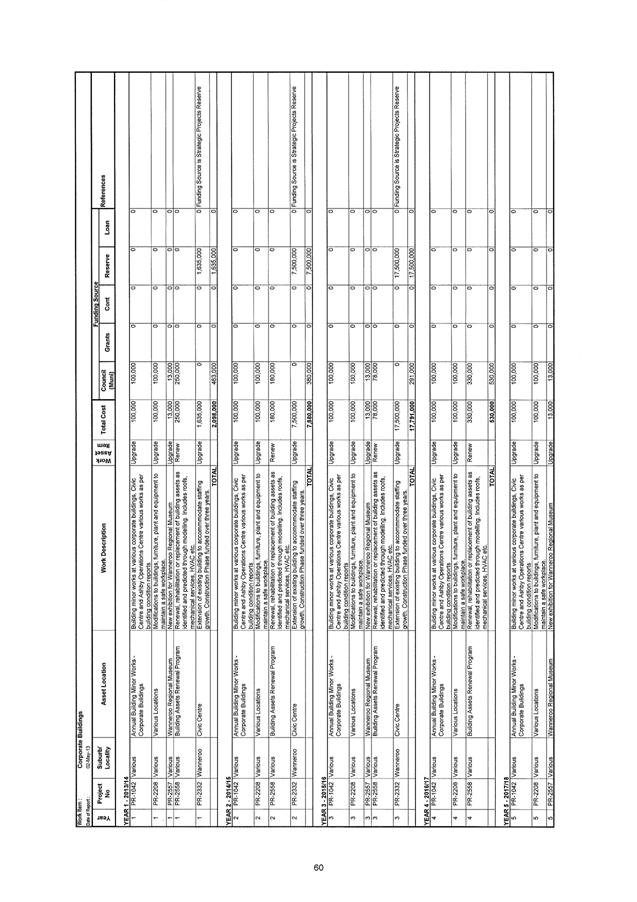
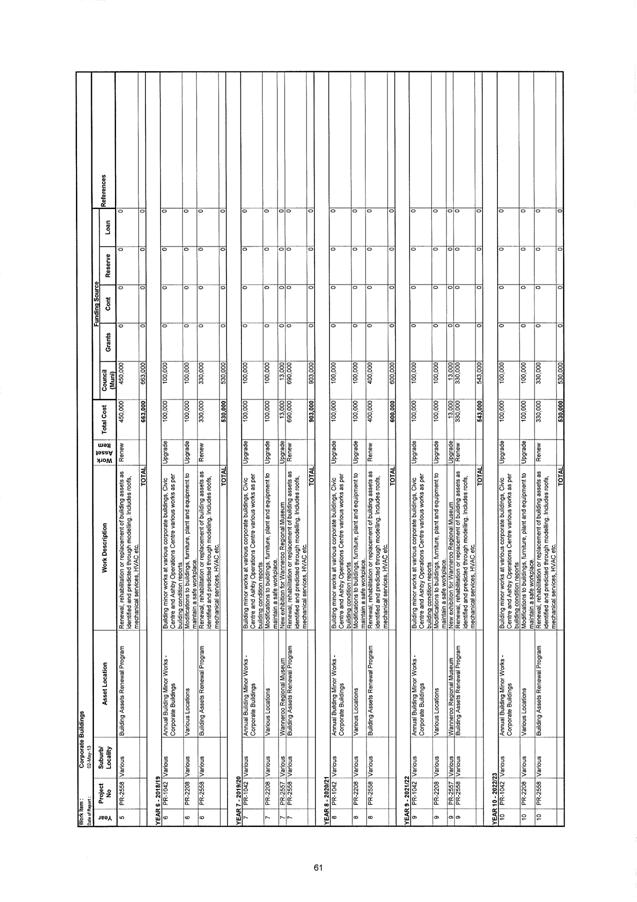
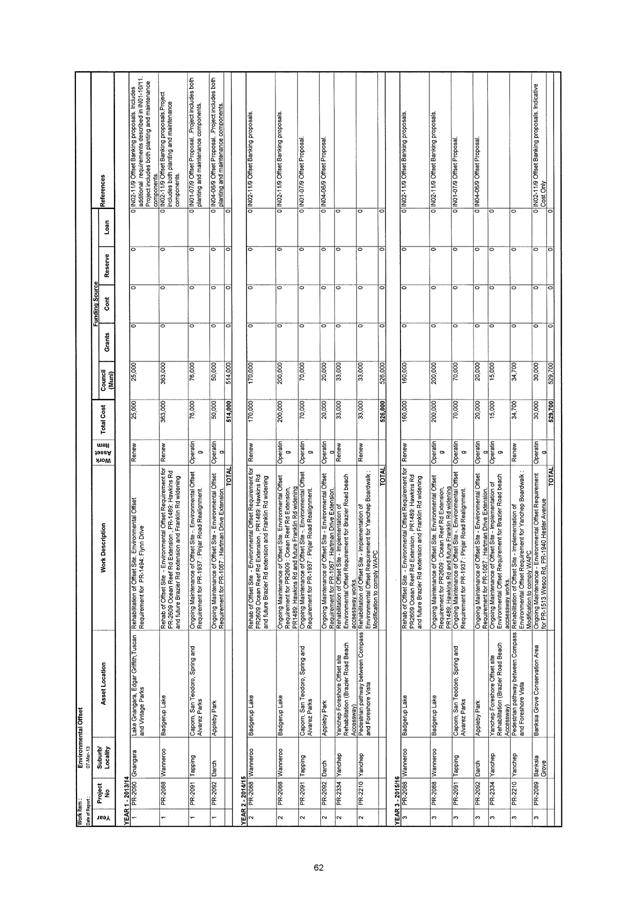
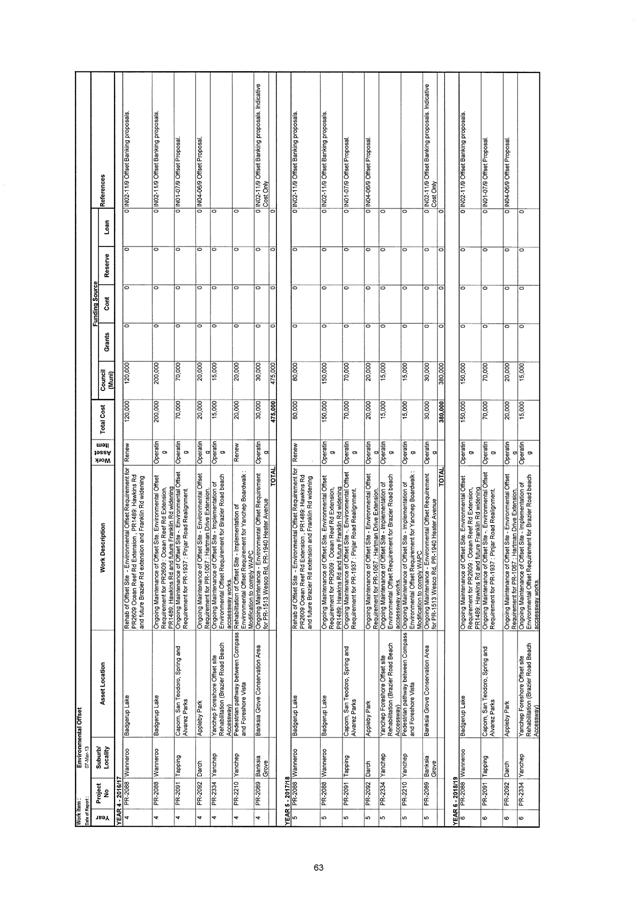
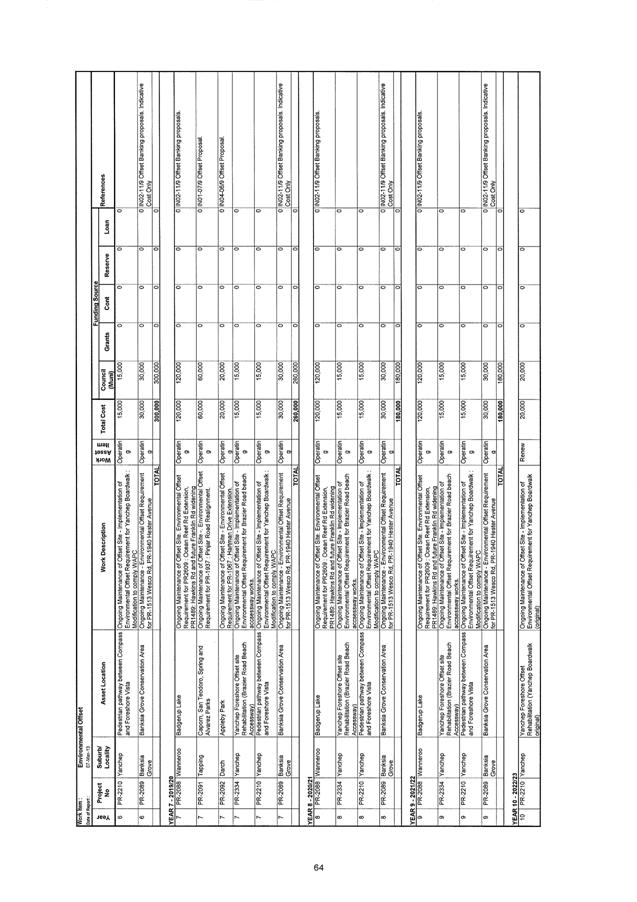
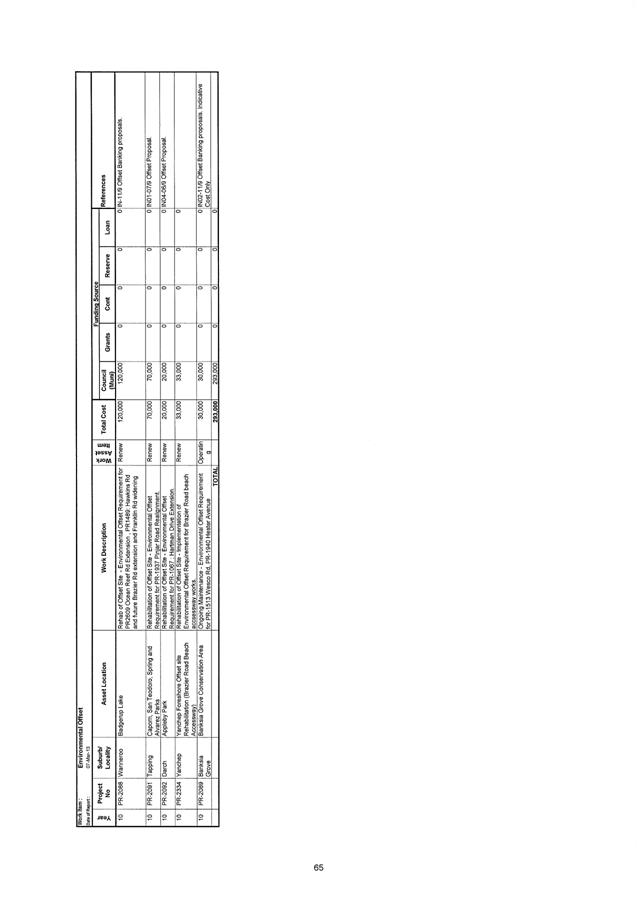
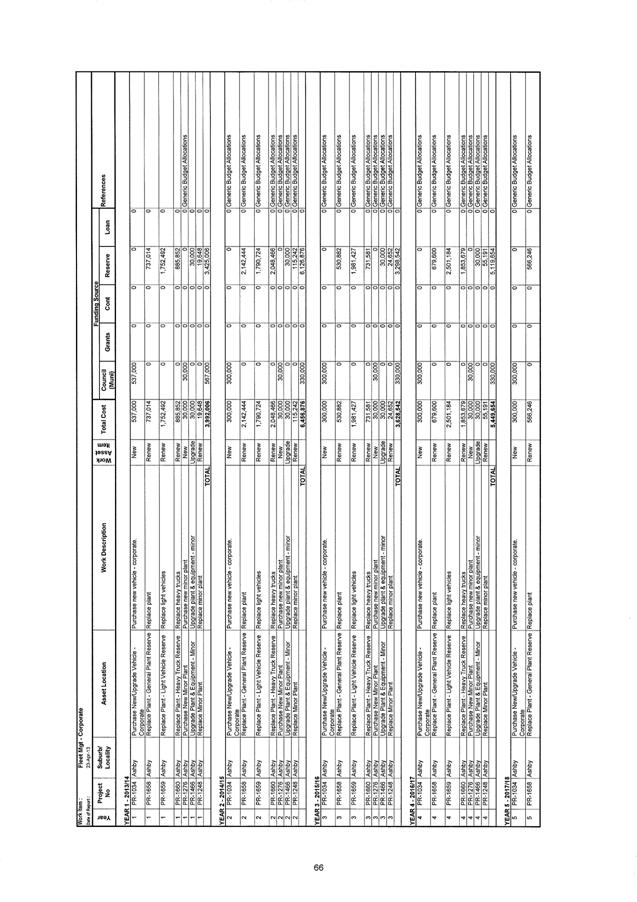
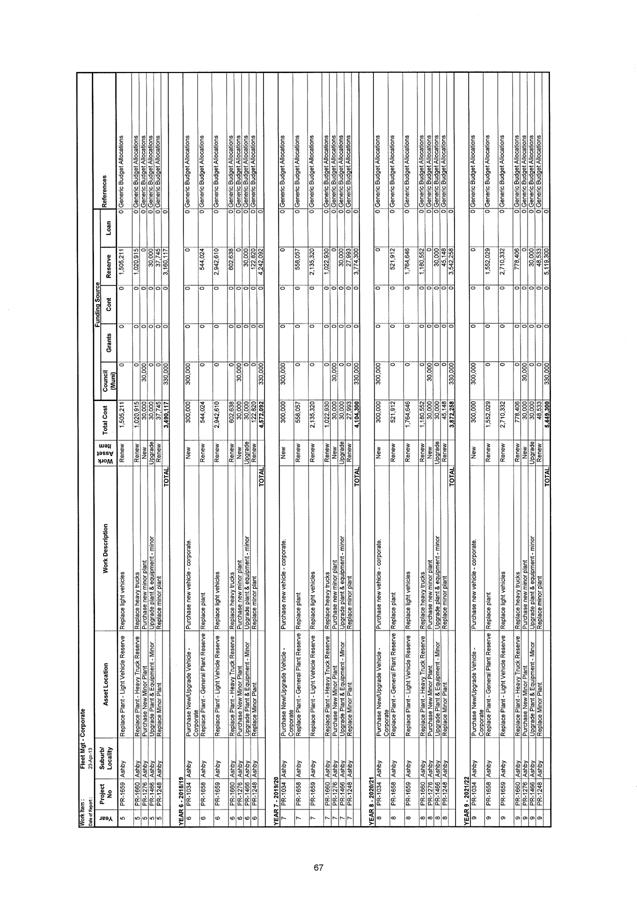
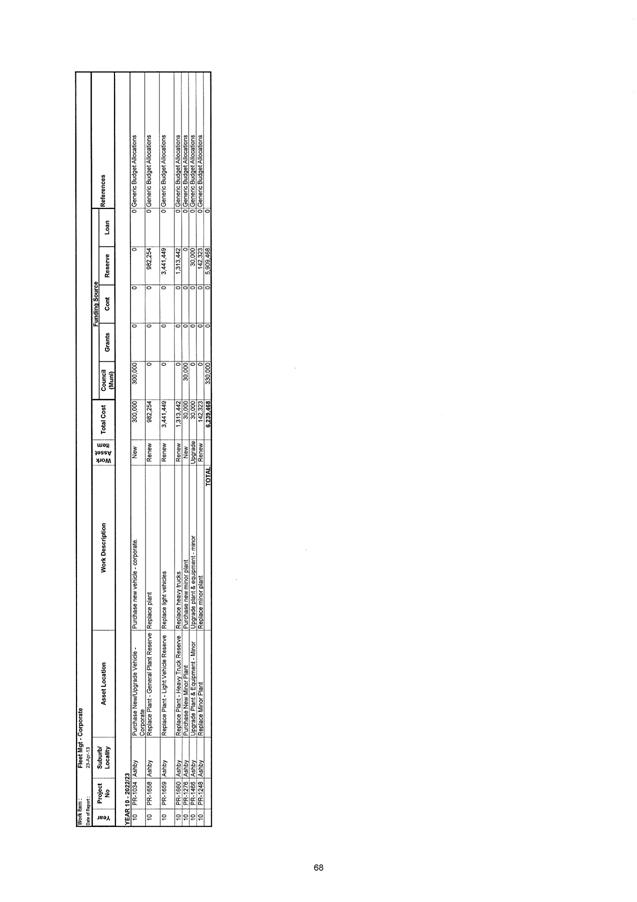
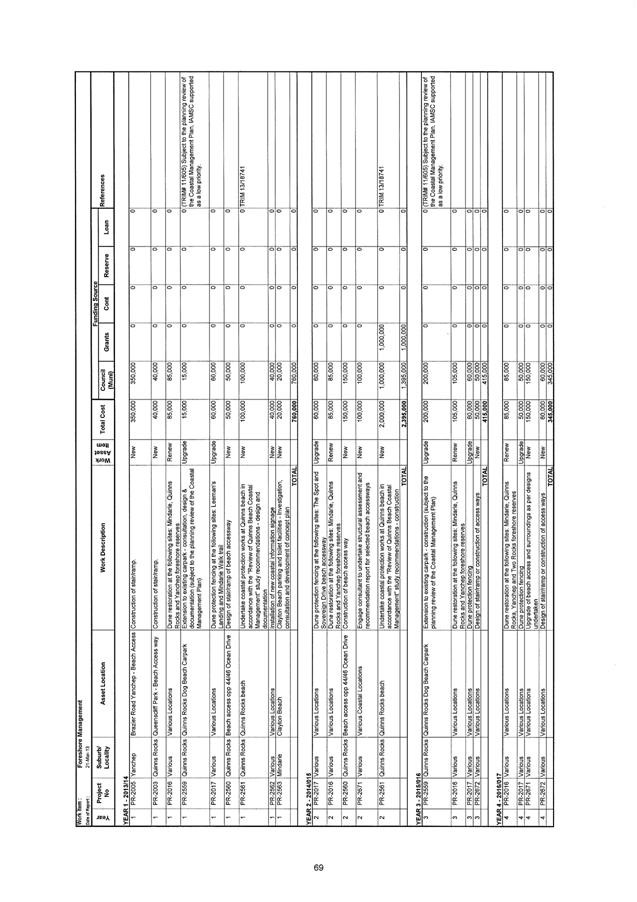
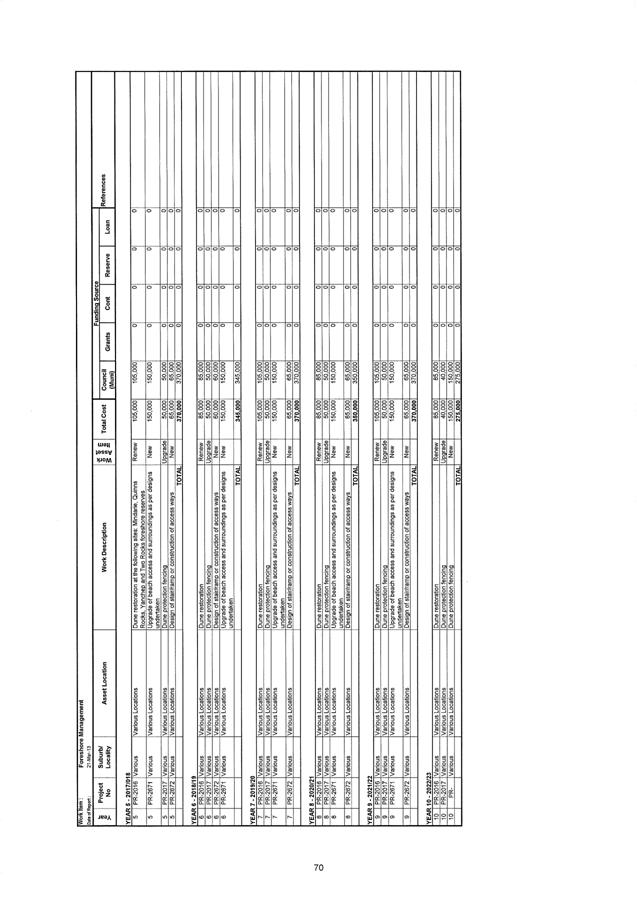
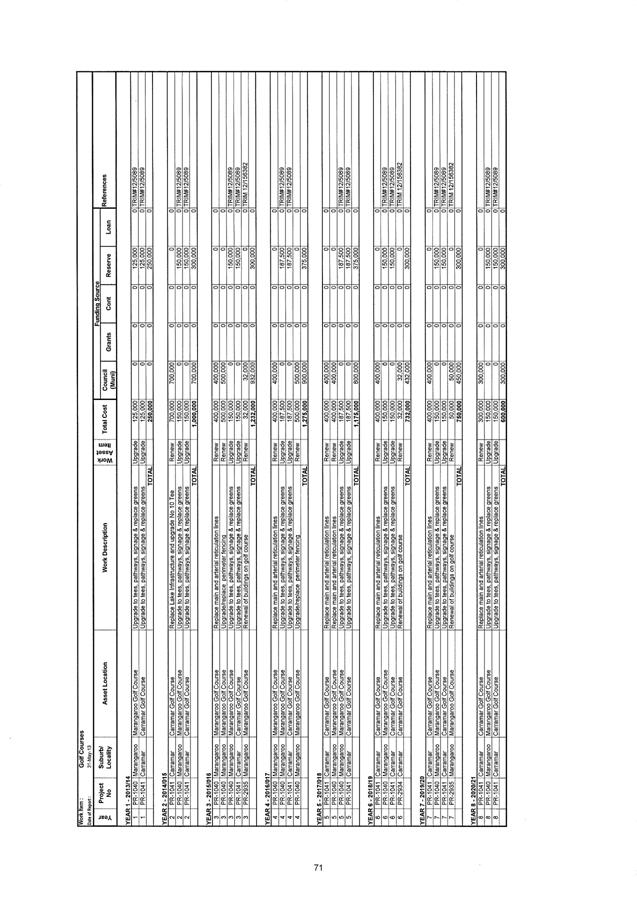
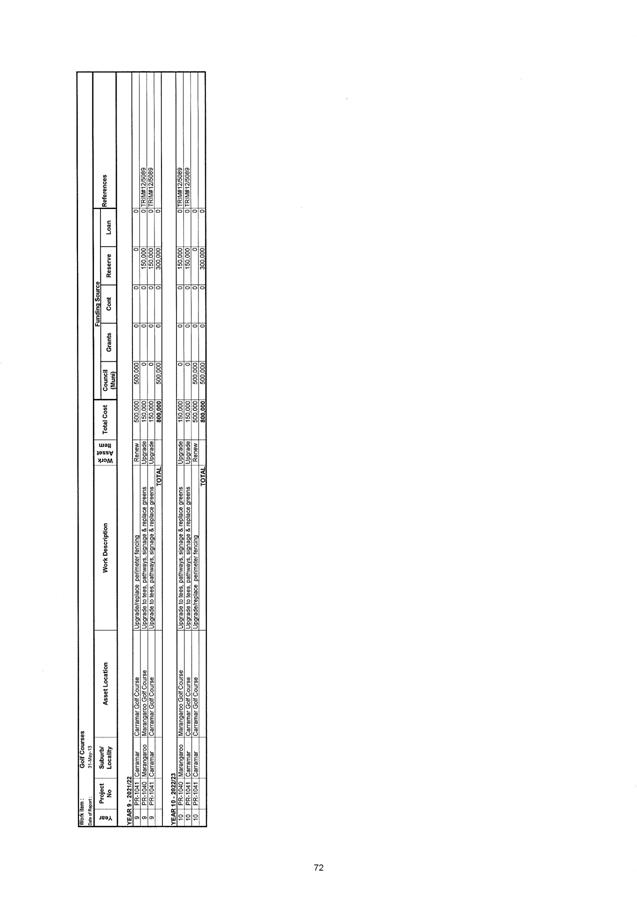
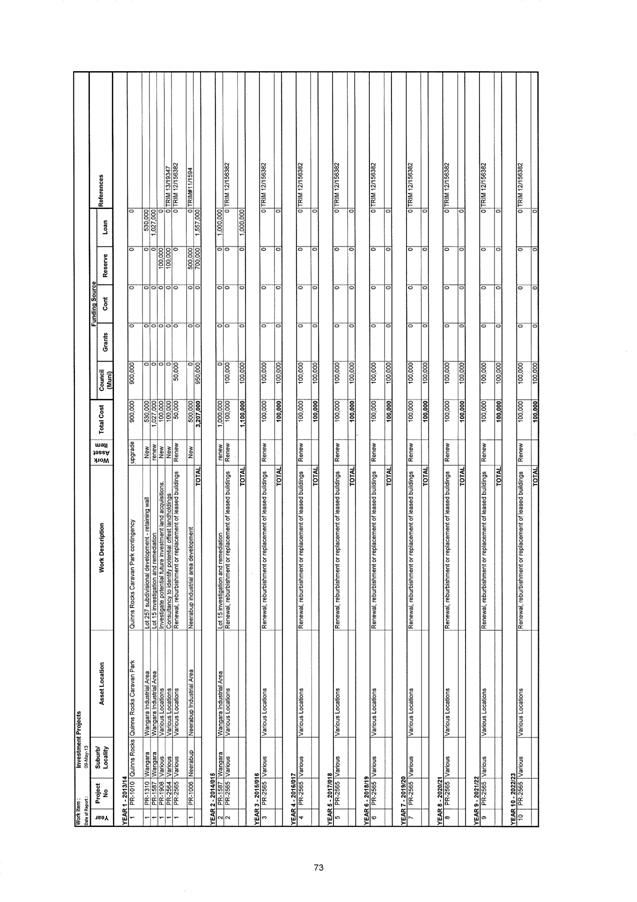
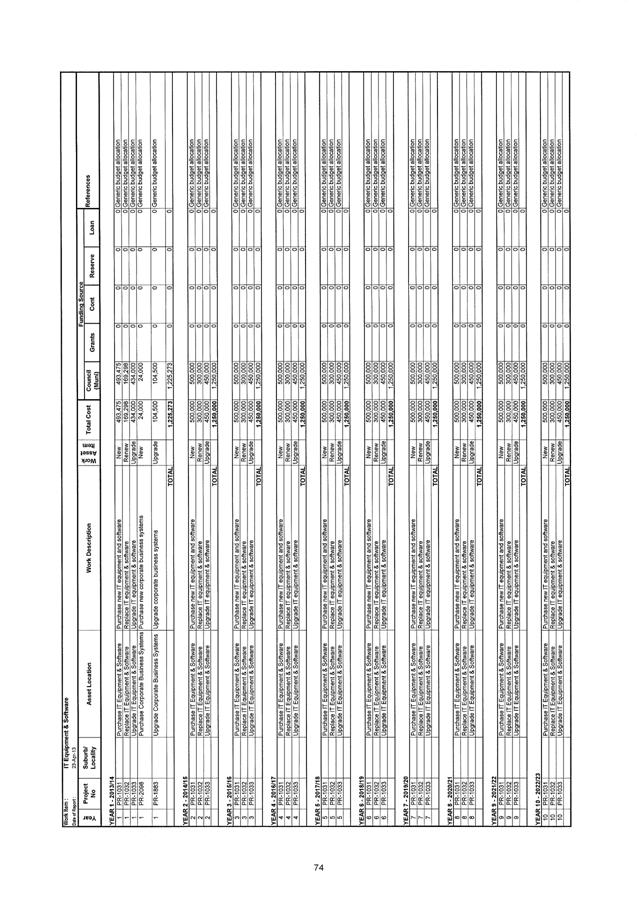
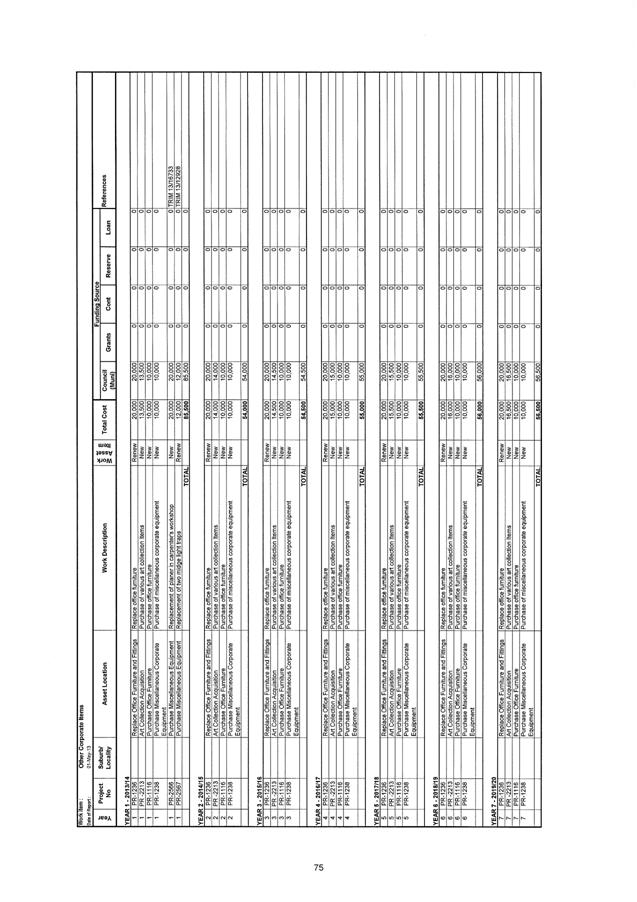
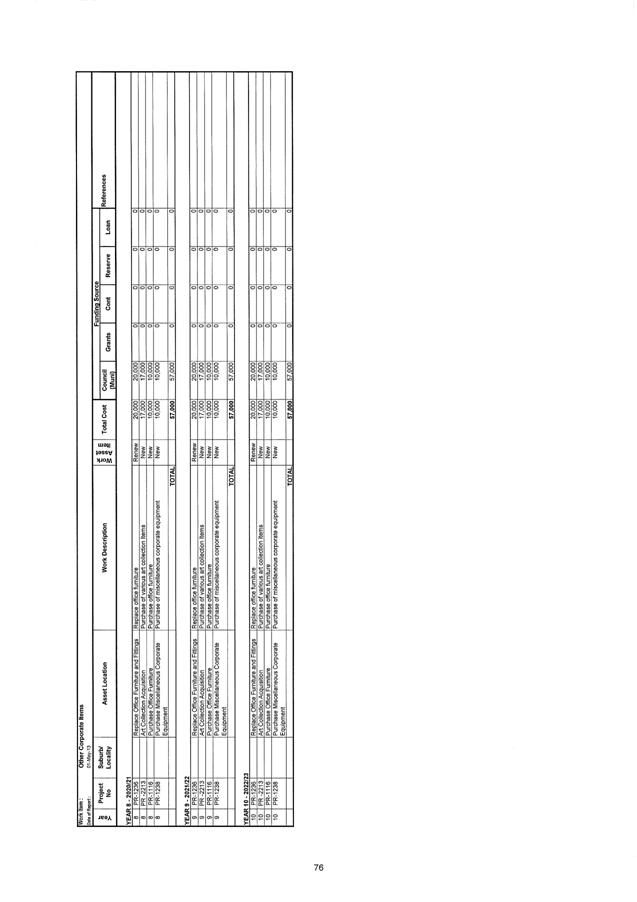
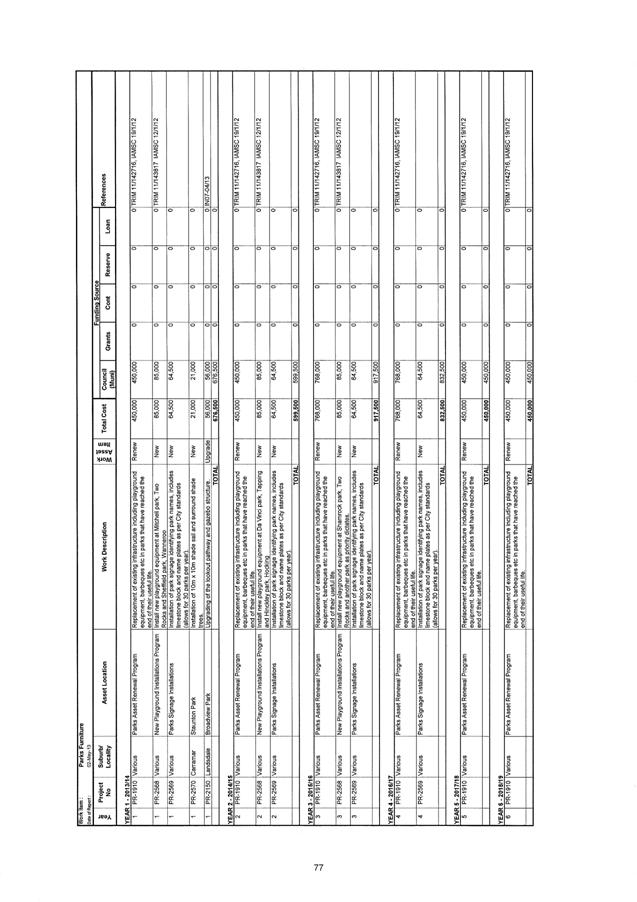
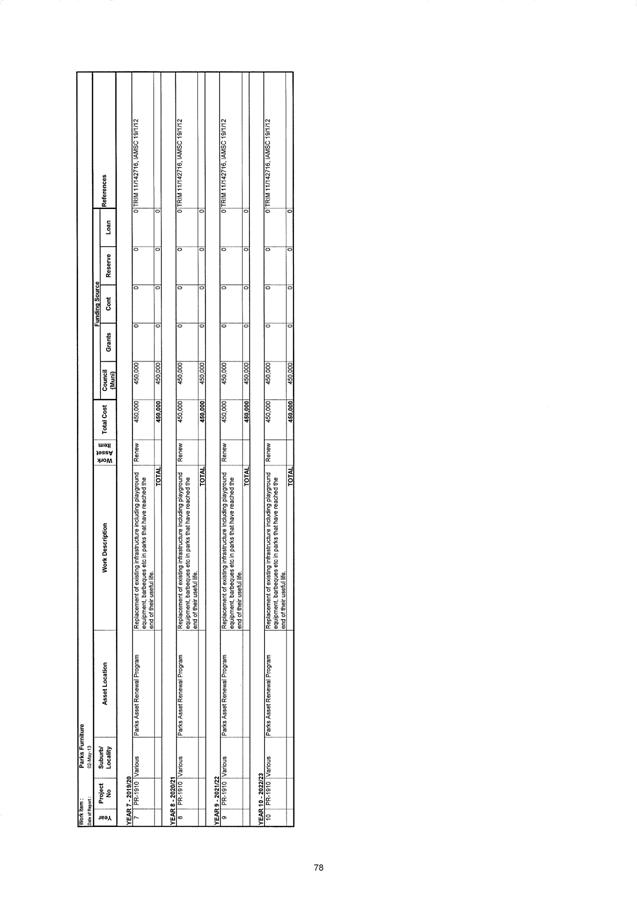
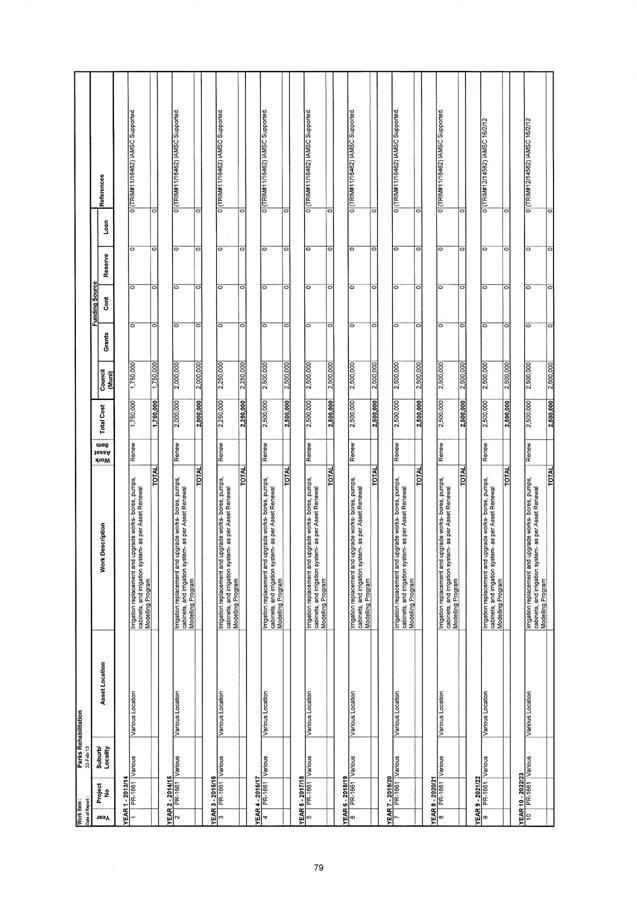
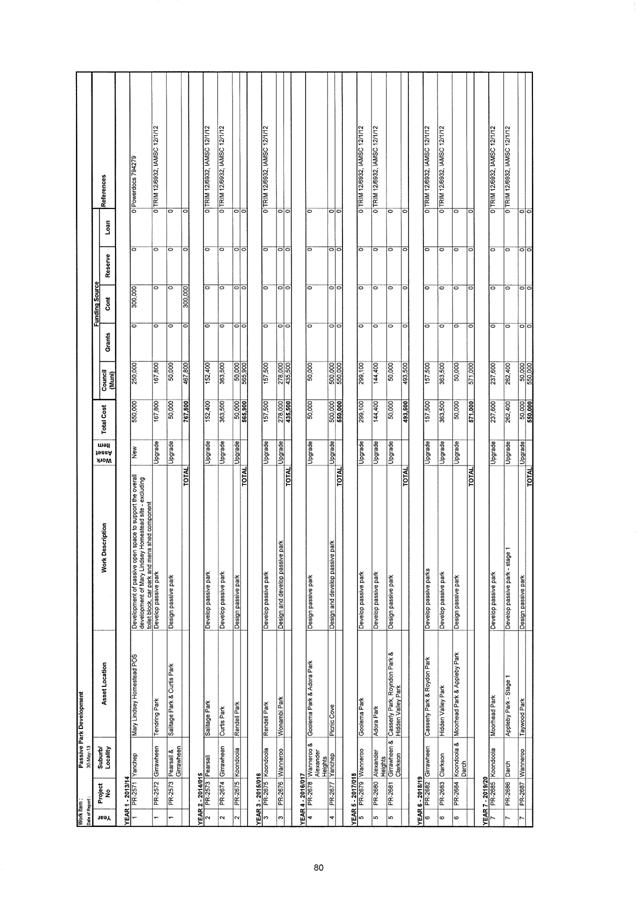
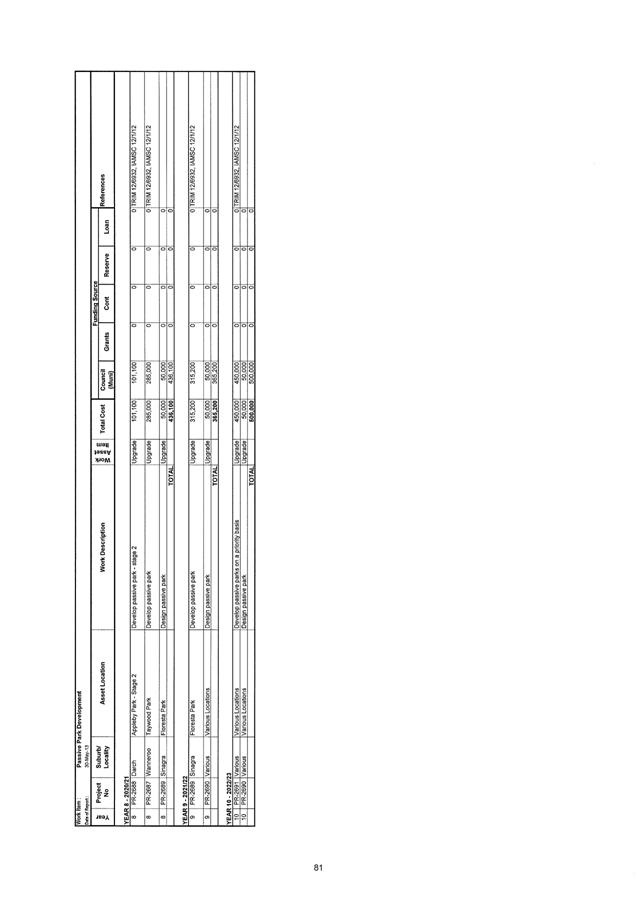
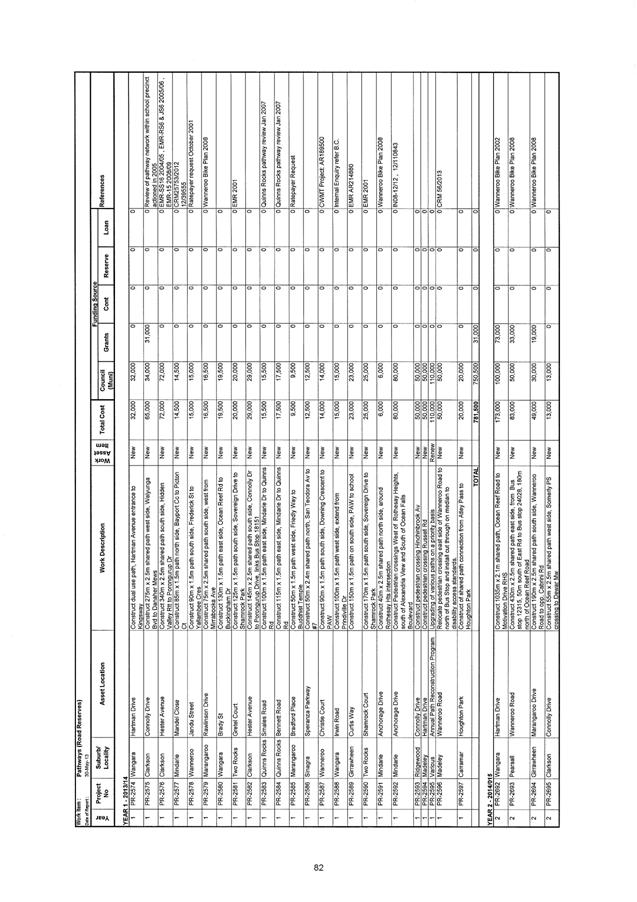
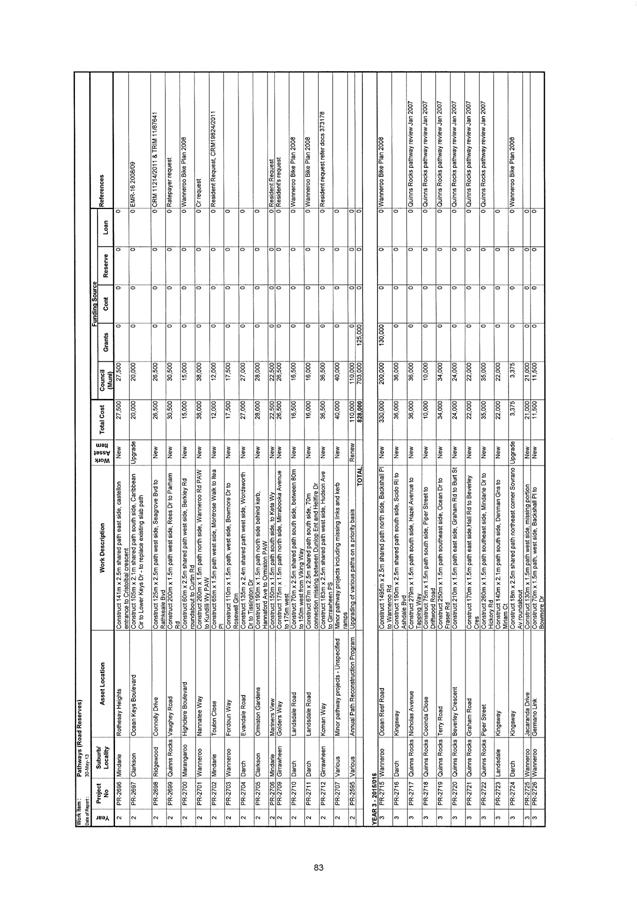
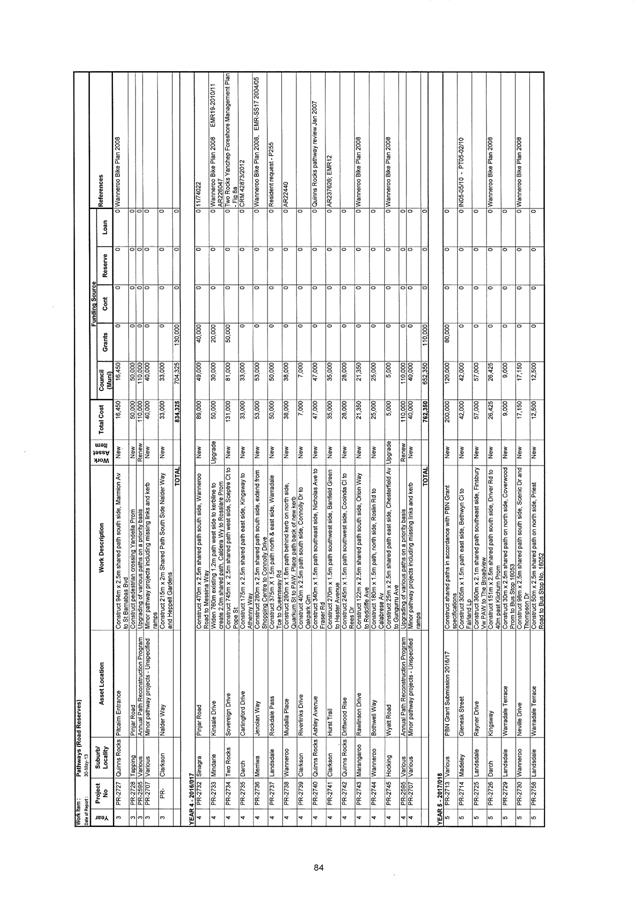
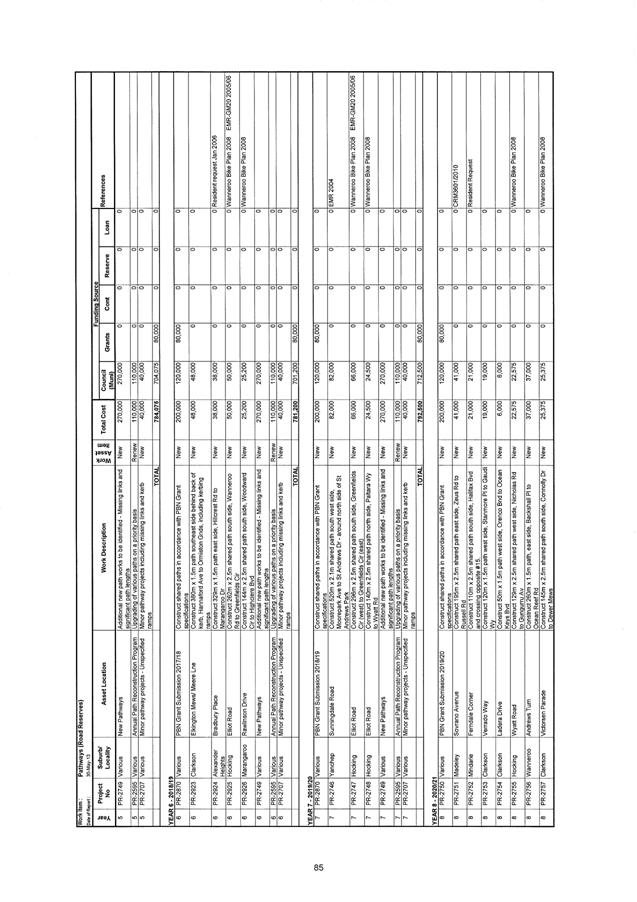
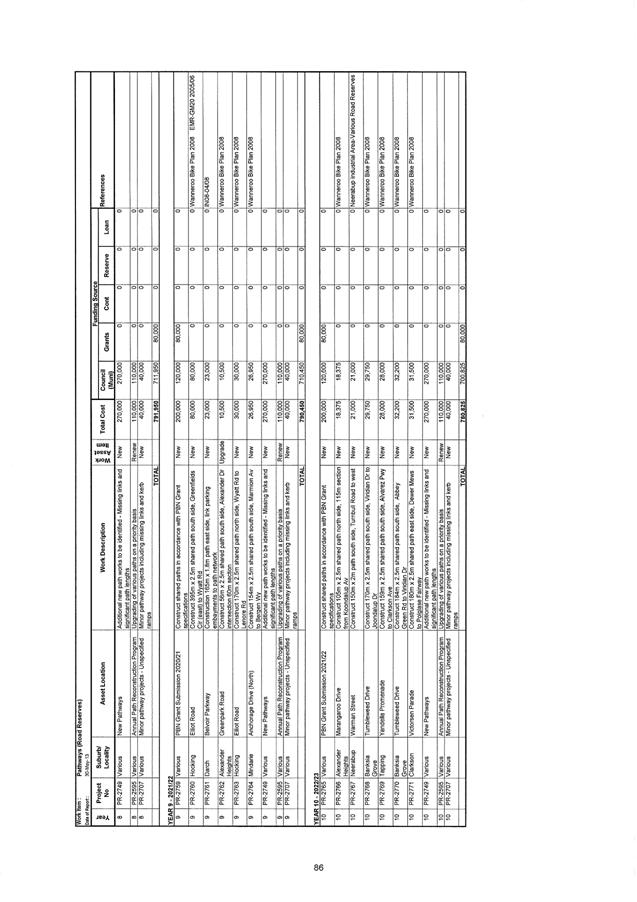
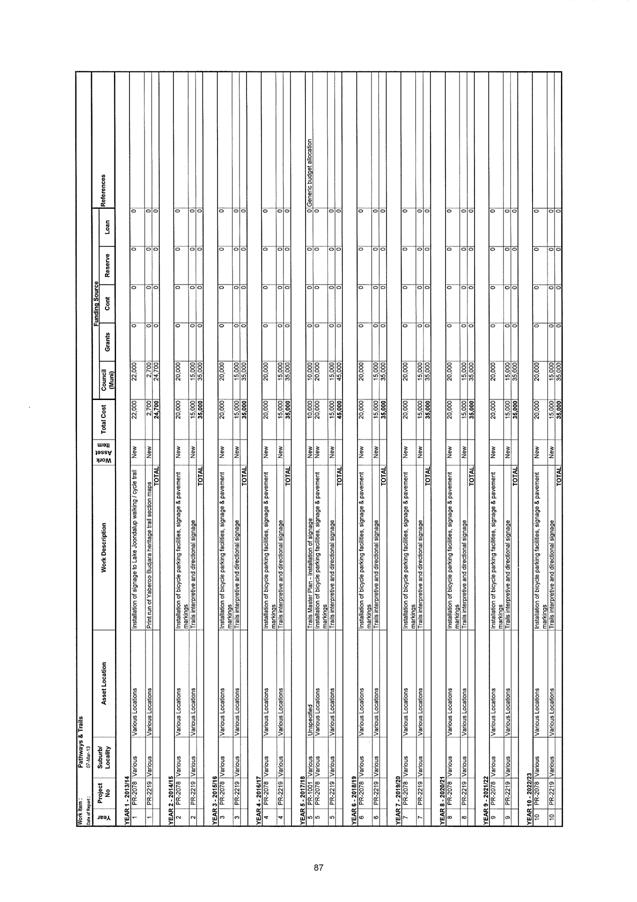
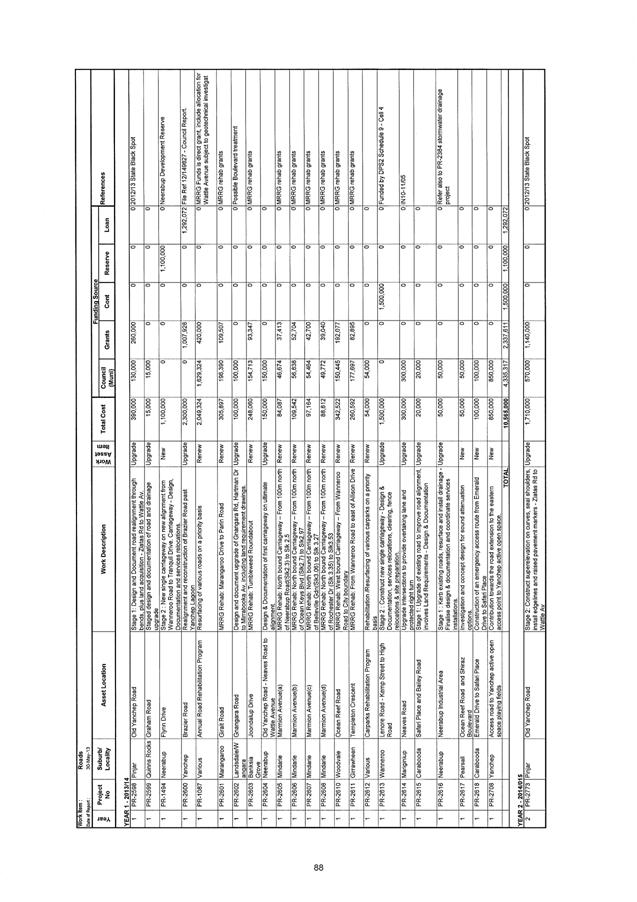
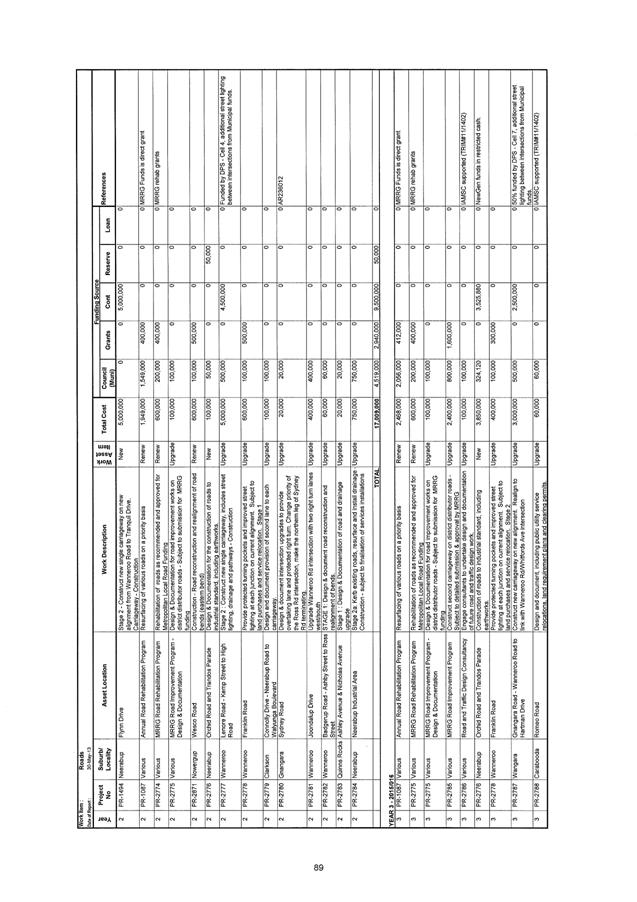
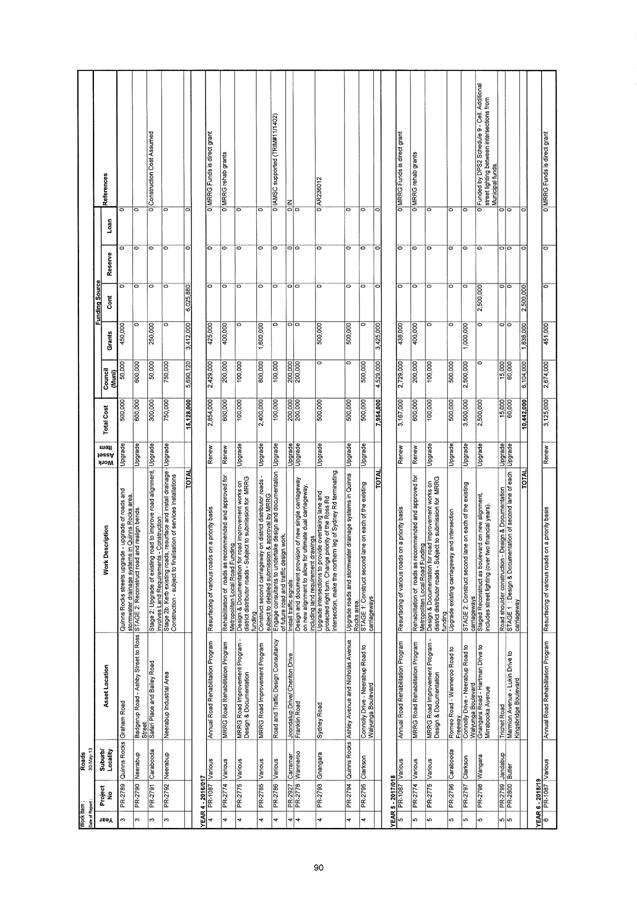
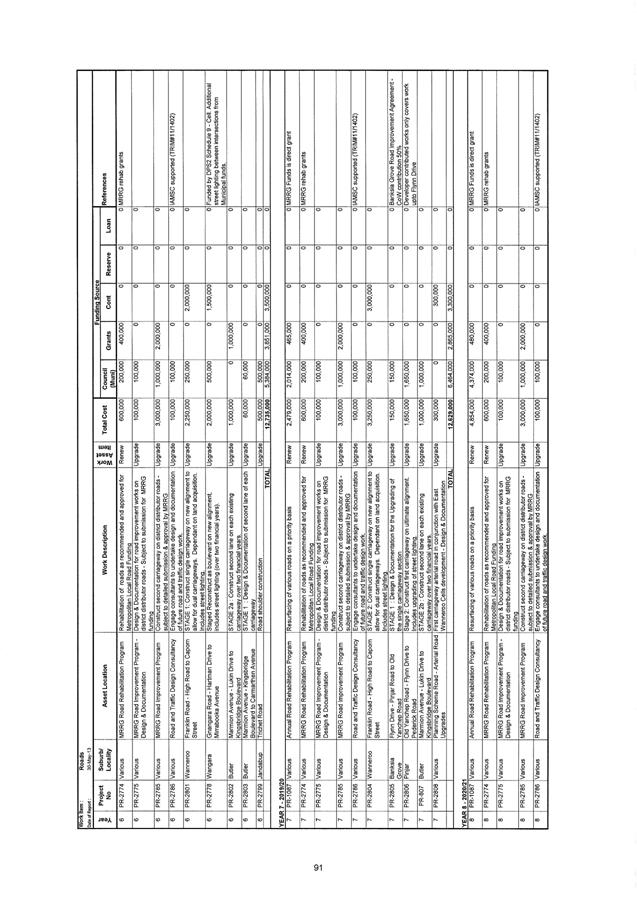
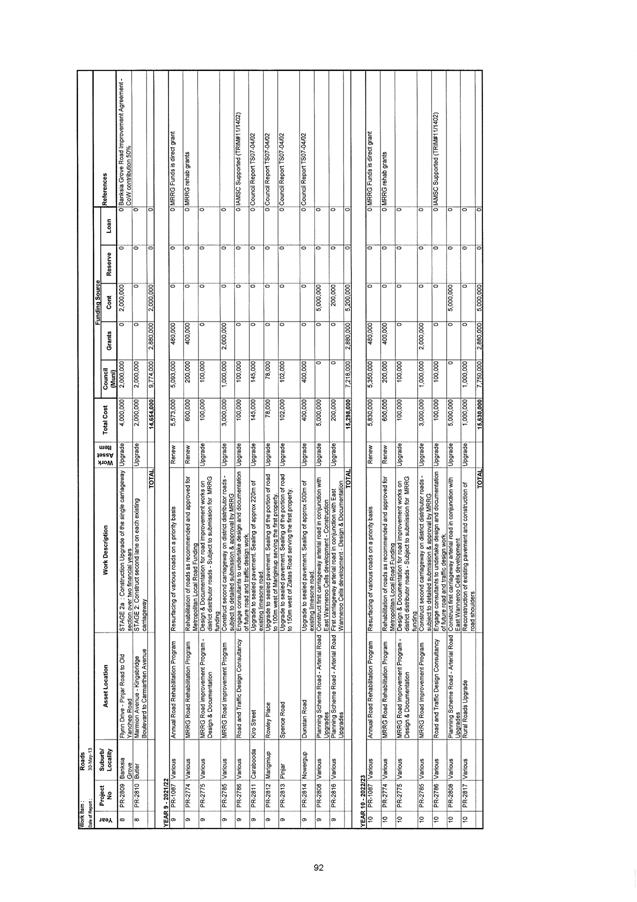
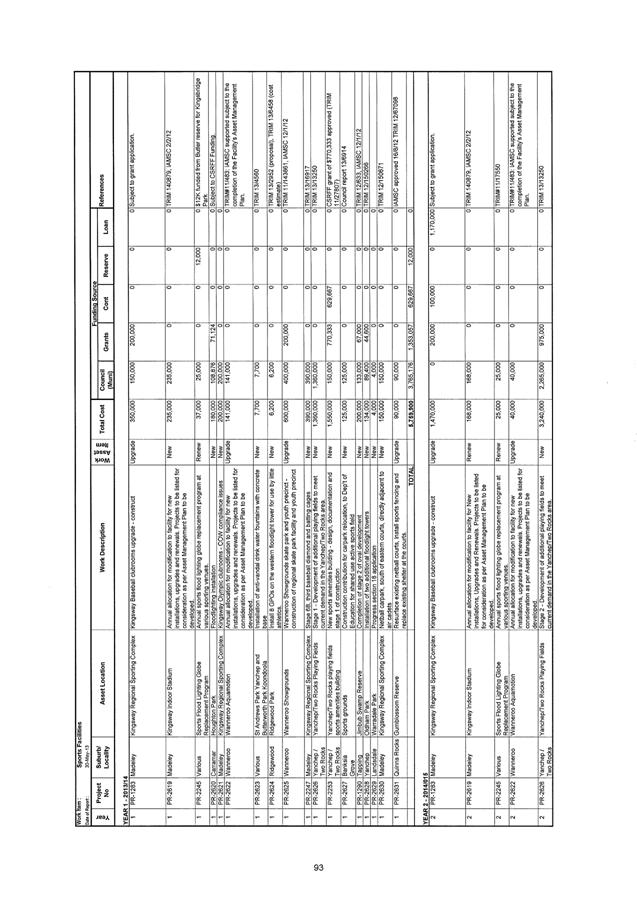
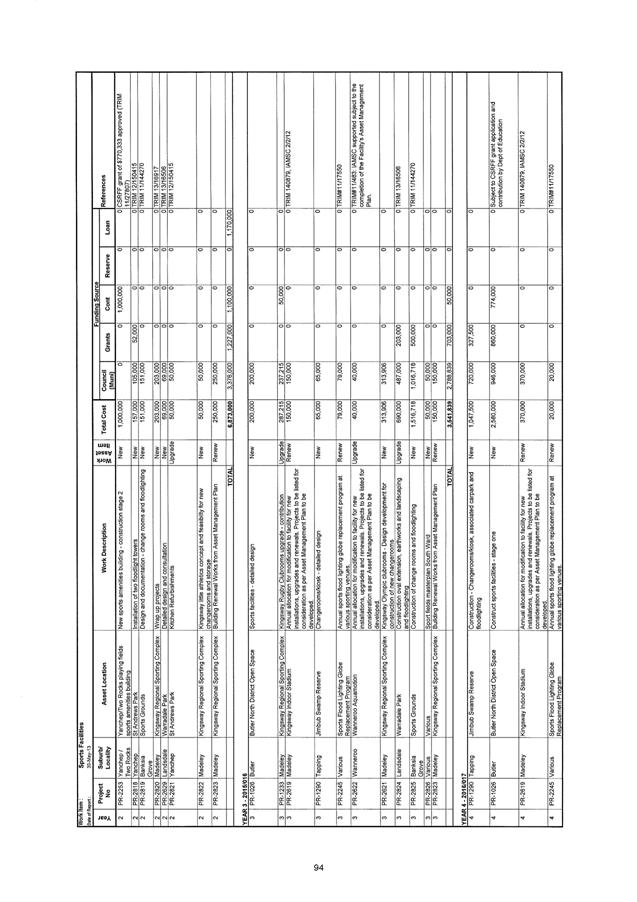
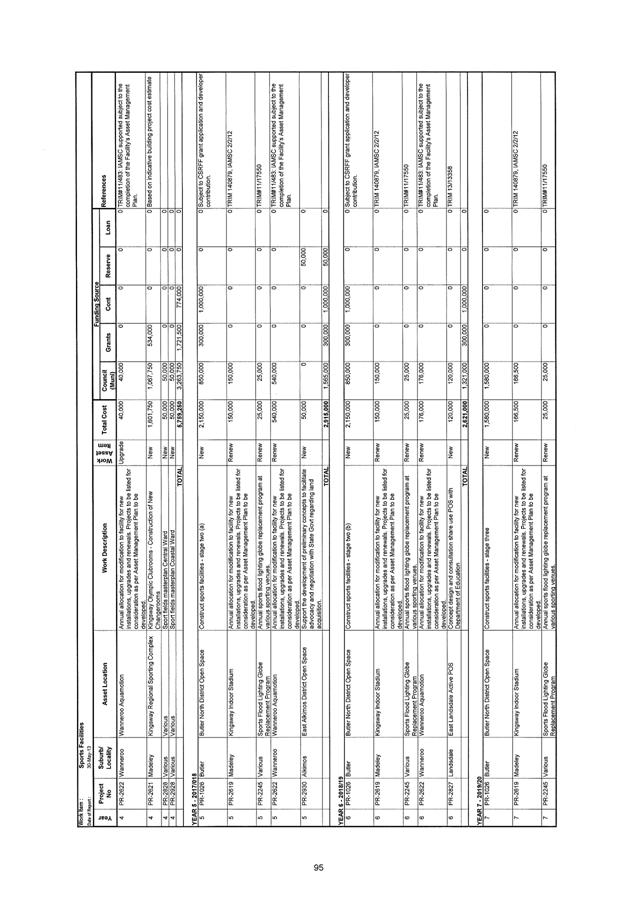
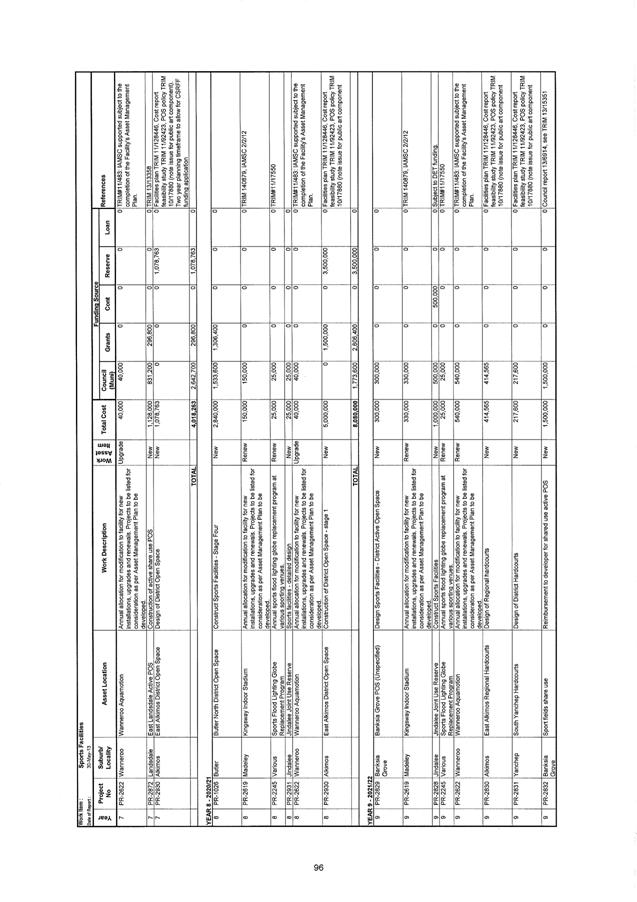
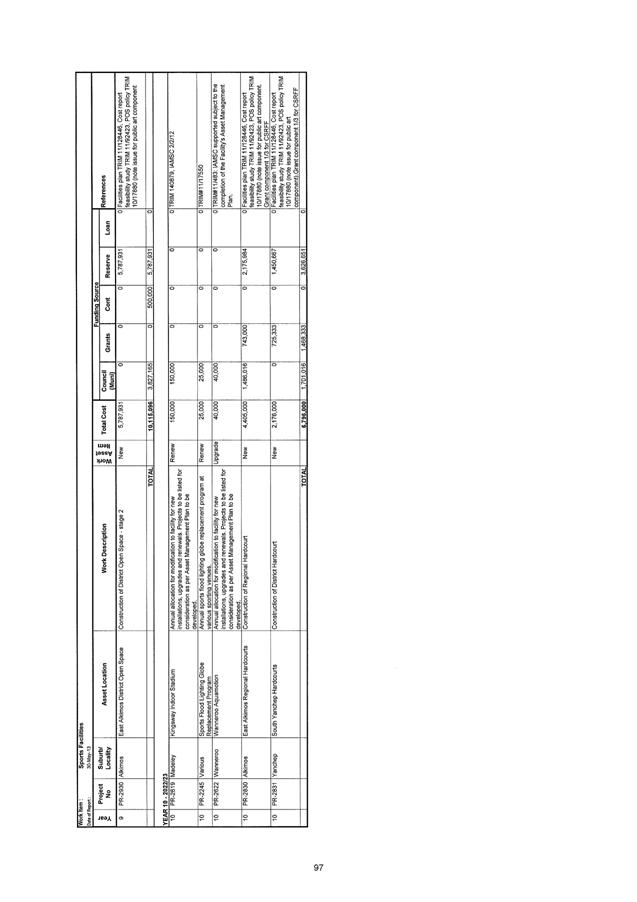
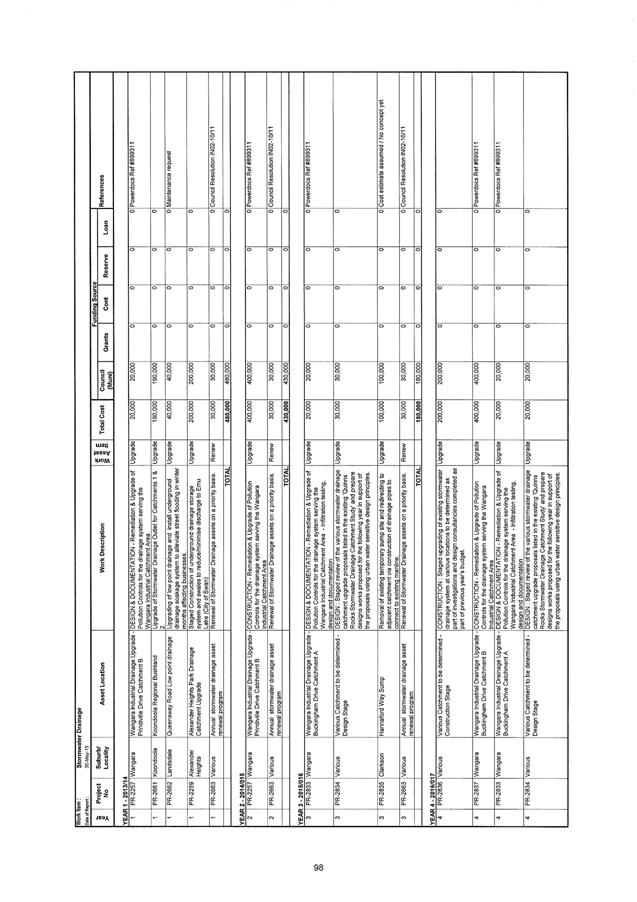
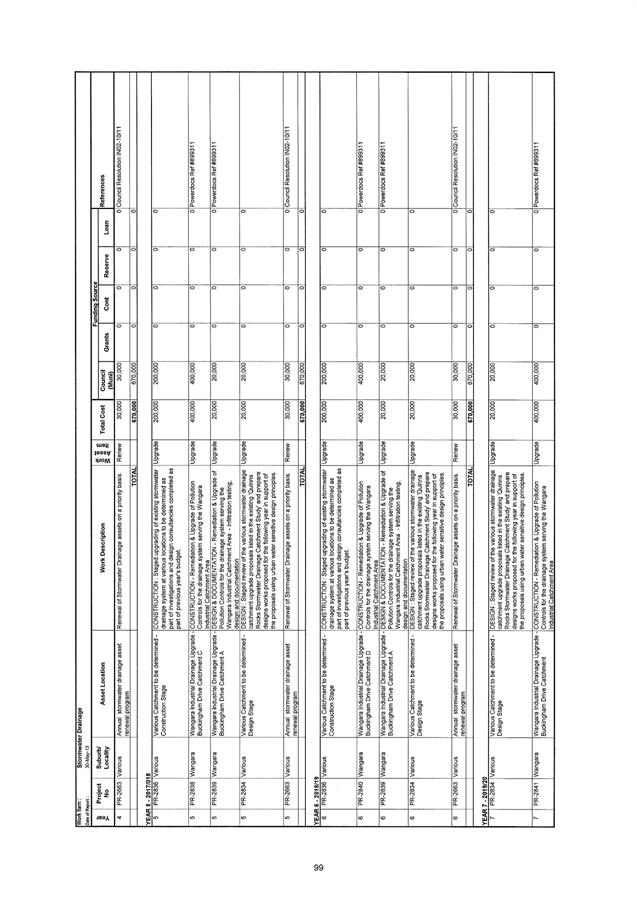
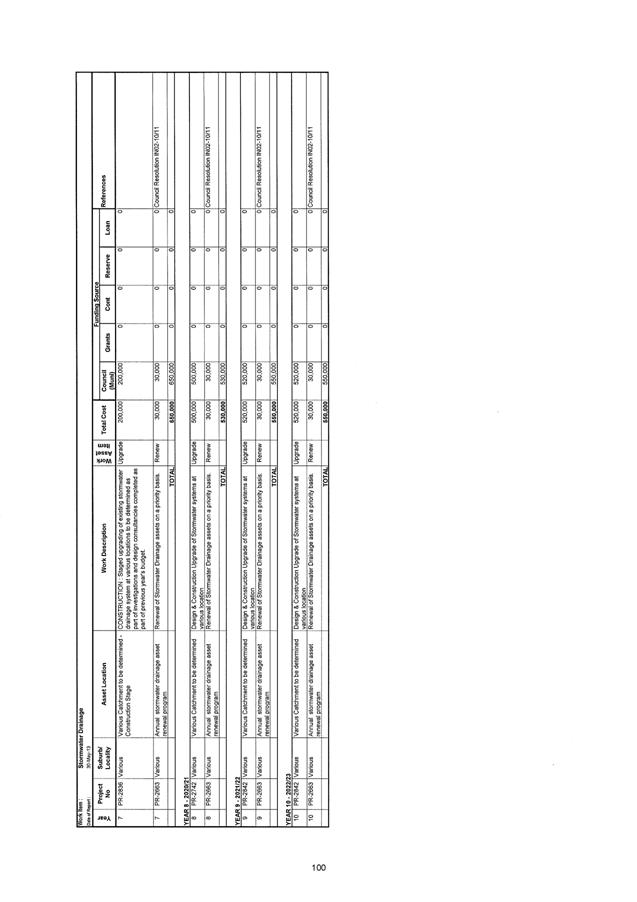
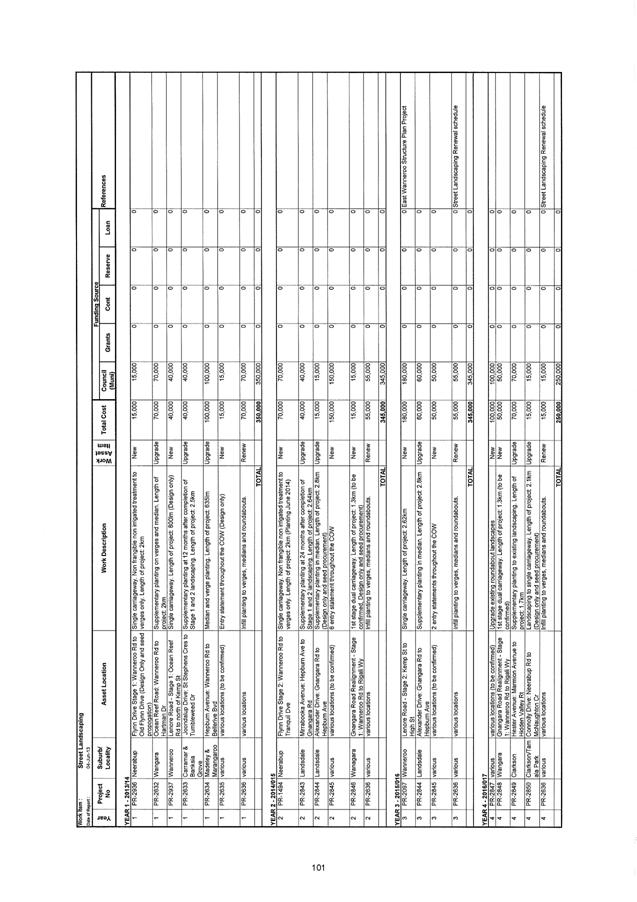
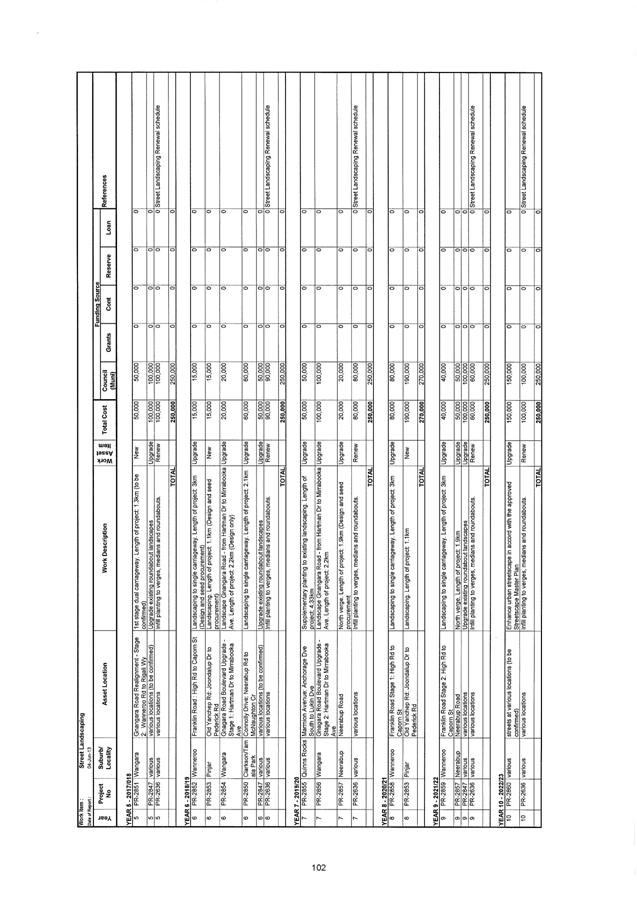
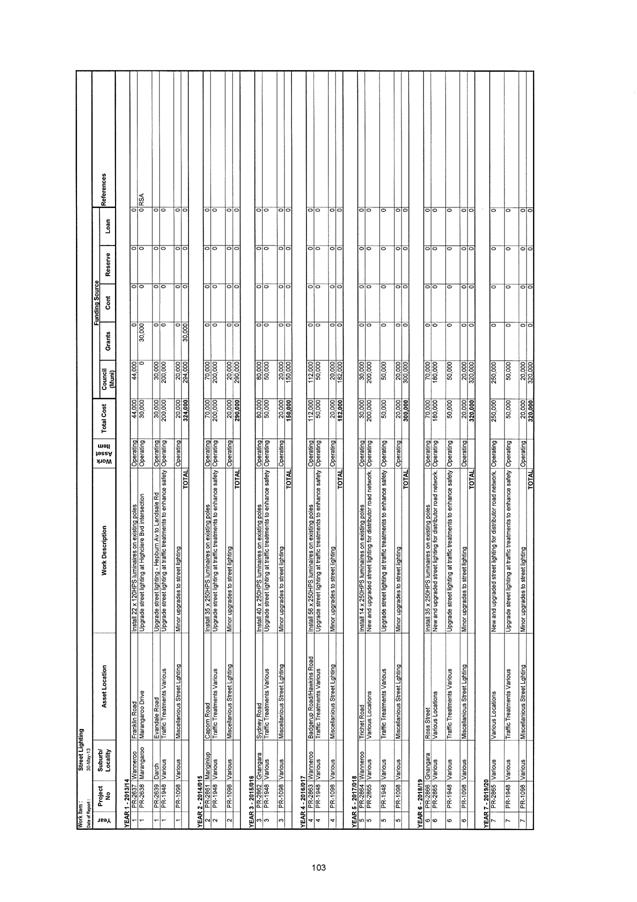
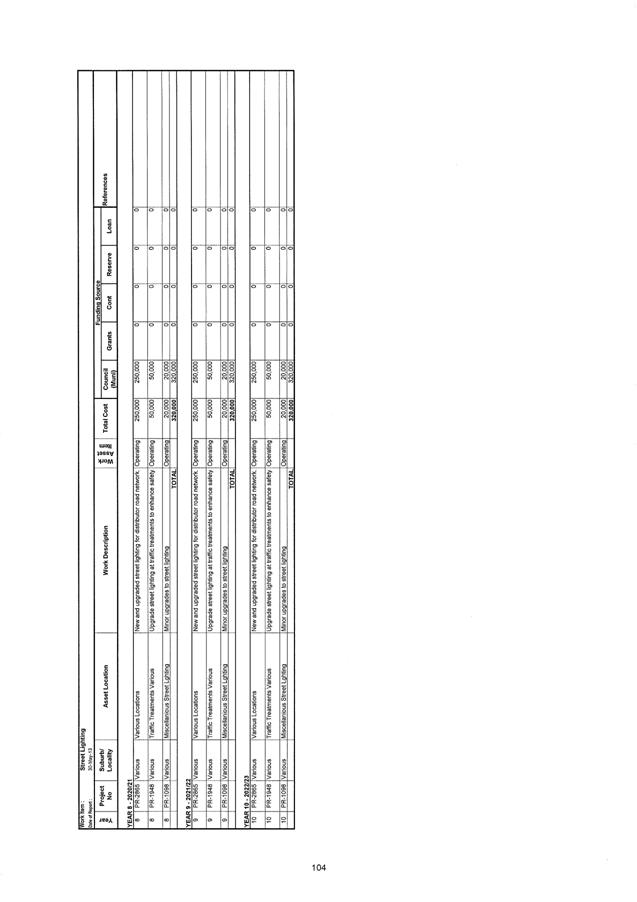
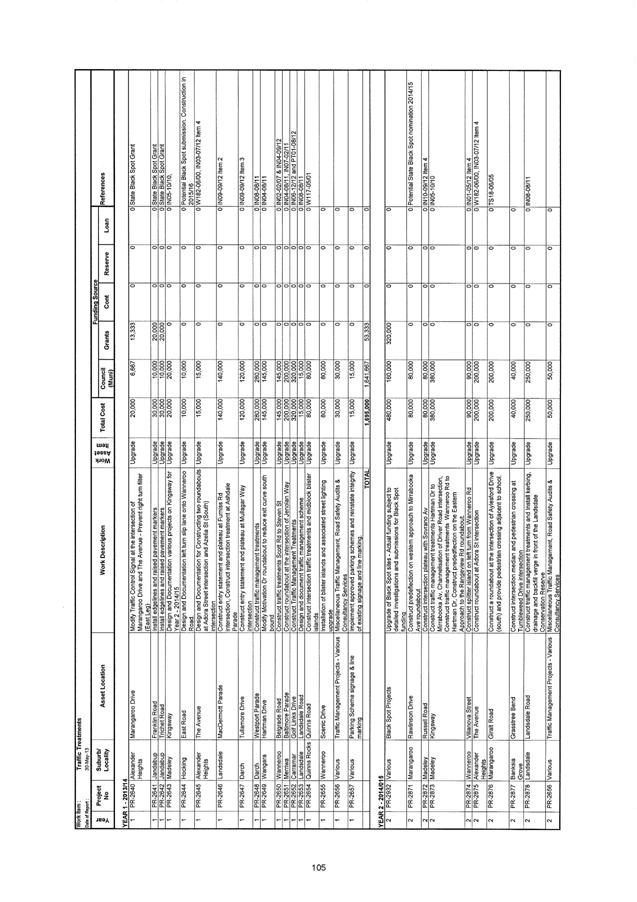
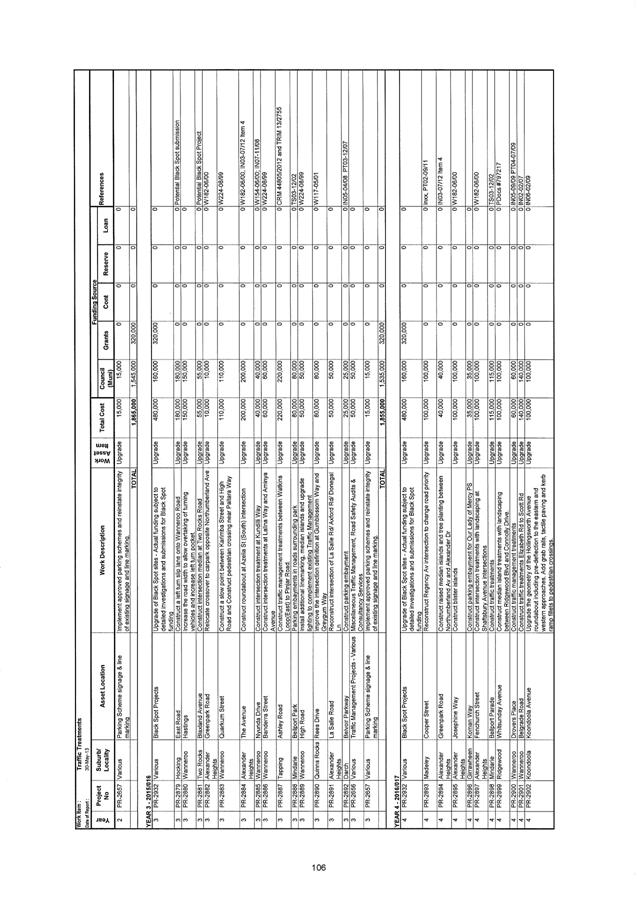
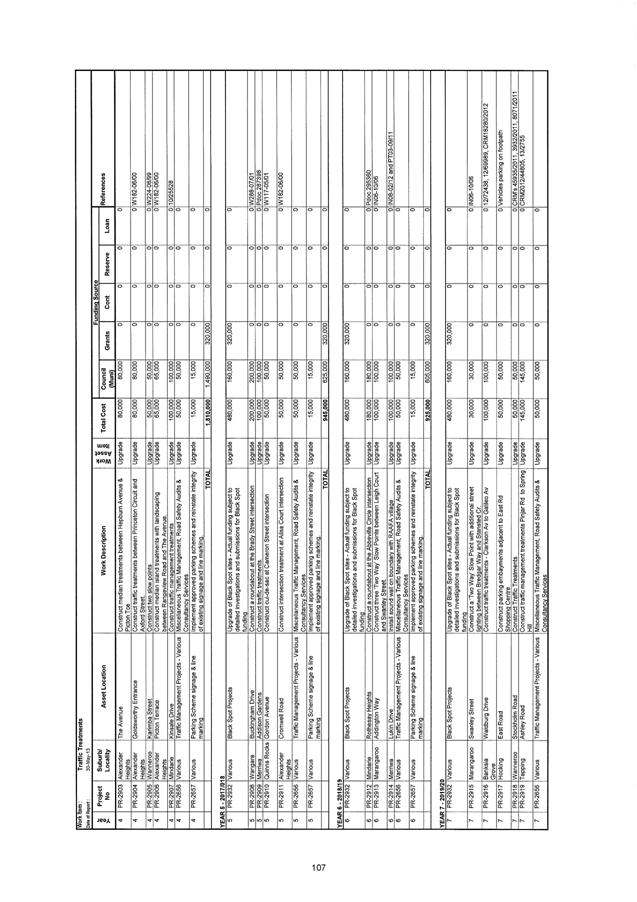
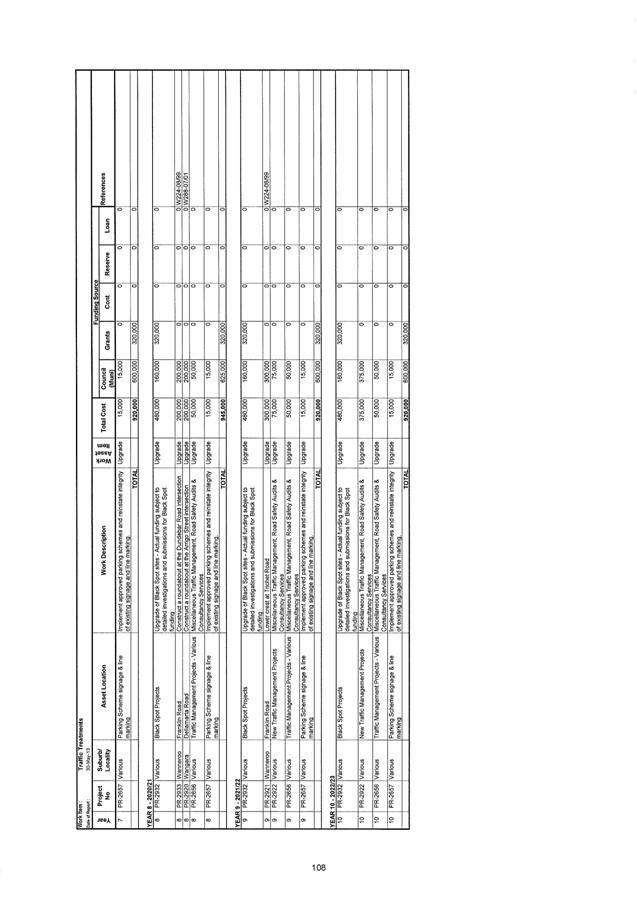
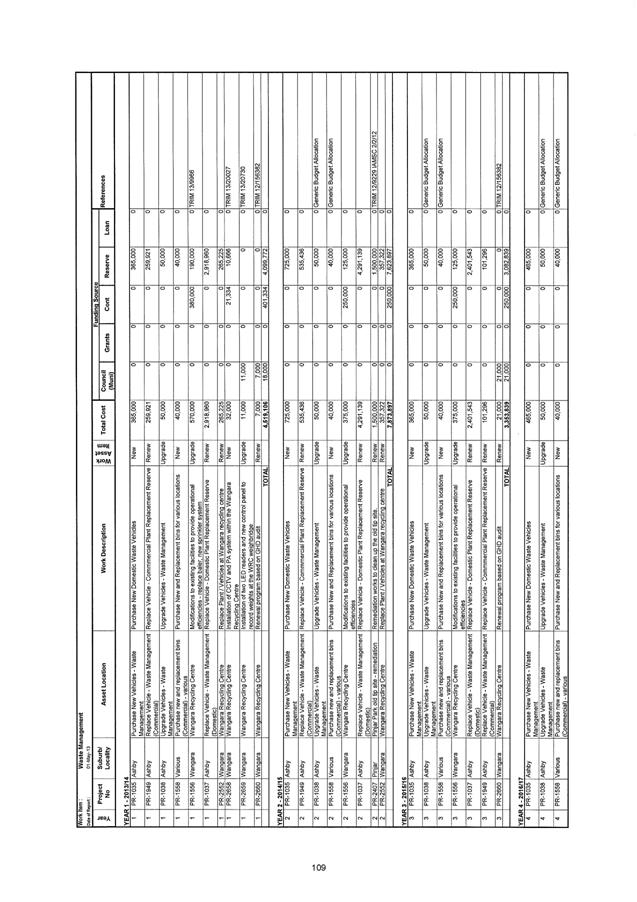
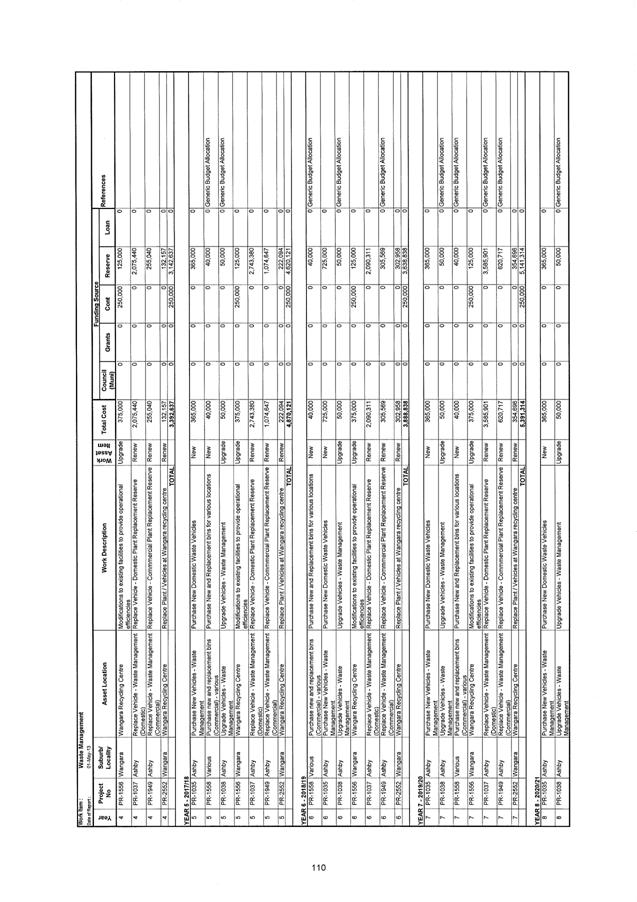
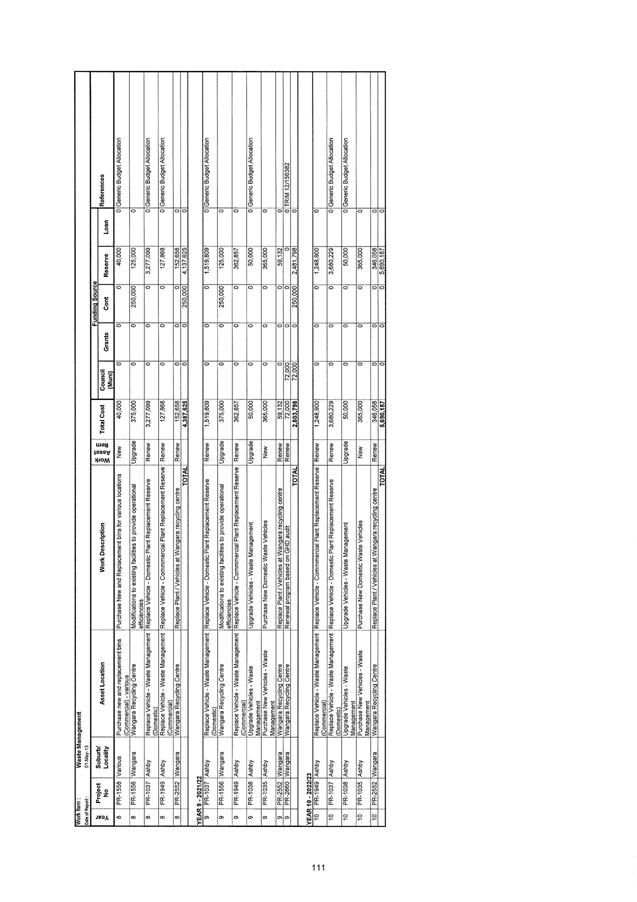
File Ref: 7018 – 13/87038
Responsible Officer: Director, Planning and Sustainability
Disclosure of Interest: Nil
Attachments: 10
Issue
To consider submissions received in respect of Amendment No. 122 to District Planning Scheme No. 2 (DPS 2) and adoption of that amendment.
|
Applicant |
City of Wanneroo |
|
Owner |
Various |
|
Location |
Alkimos Eglinton & Yanchep Two Rocks localities |
|
Site Area |
~100km2 |
|
MRS Zoning |
Various |
|
DPS 2 Zoning |
Various |
Background
At its meeting of 7 February 2012, Council resolved to adopt Amendment No. 122 to DPS 2 for the purpose of public advertising (Item PS03-02/12). At that same meeting, Council resolved to adopt the Northern Coastal Growth Corridor (NCGC) Community Facilities Plan (CFP) to support the public advertising of Amendment No. 122 (Item PS02-02/12) and required Administration to review the CFP in light of submissions received on Amendment No. 122 and to submit a report on the same to Council, concurrently with Amendment No. 122.
Amendment No. 122 proposes to:
(i) Modify Clause 5.5.1 of DPS 2 to introduce two new special control areas relating to the Alkimos Eglinton and Yanchep Two Rocks Development Contribution Areas;
(ii) Modify "Schedule 16 – Special Control Areas" of DPS 2 to introduce two new Special Control Areas relating to the Alkimos Eglinton and Yanchep Two Rocks Development Contribution Areas;
(iii) Introduce three new Schedules (Schedules 18, 19 and 20) into DPS 2 pertaining to:
a. Text provisions relating to the operation of the new Development Contribution Plans (DCPs);
b. Alkimos Eglinton DCP; and
c. Yanchep Two Rocks DCP.
(iv) Amend the Scheme Map to show the Special Control Areas proposed to be introduced.
A copy of the advertised Amendment No. 122 text and maps is included as Attachment 1.
In accordance with Council's February 2012 resolution, Amendment No. 122 was referred to the Environmental Protection Authority (EPA) for assessment, prior to being advertised for public comment. The EPA advised that the Amendment did not require environmental assessment, and therefore Amendment No. 122 was advertised for public comment for a period of 42 days.
The Amendment No. 122 report that was advertised for public comment included the Draft DCP Report covering both DCP areas, together with the Draft CFP adopted by Council in February 2012.
Detail
Amendment No. 122 to DPS 2, as advertised, comprises the following three key components:
1. Special Control Areas
Amendment No. 122 proposes to introduce two new "Special Control Areas" under DPS 2 that would apply individually to the Alkimos Eglinton and Yanchep Two Rocks DCP areas.
2. New Schedules
Amendment No. 122 proposes to introduce three new Schedules into DPS 2, as follows:
a) A new Schedule 18 comprising "Model Scheme Text" provisions to implement DCPs through DPS 2, including definitions, principles and detailed provisions on the operation of the DCPs.
b) A new Schedule 19 describing the infrastructure and administrative items to be funded by the Alkimos Eglinton DCP, together with the methodology for calculating cost contributions, the period of operation and the review framework.
c) A new Schedule 20 describing the infrastructure and administrative items to be funded by the Yanchep Two Rocks DCP, together with the methodology for calculating cost contributions, the period of operation and the review framework.
3. Amendments to Scheme Map
The Scheme Map is proposed to be amended to show the new Special Control Areas to be introduced by Amendment No. 122.
It is important to note that Amendment No. 122 will only introduce and provide the 'head of power' for the City to administer DCPs for Alkimos Eglinton and Yanchep Two Rocks to collect contributions for the provision of district-level facilities identified in the CFP. Although the amending text to be inserted in DPS 2 makes reference to the DCP Report and a cost apportionment schedule, these details do not form part of Amendment No. 122 and will not be included in DPS 2 as a result of this Amendment. Details regarding facility scope and cost estimates, construction timing and cost apportionment among landowners will be included in the final DCP Report and/or CFP (as appropriate) to be agreed by Council. Both of these documents will sit outside of but be 'called up' by DPS 2. Council is required to adopt the final DCP and related CFP within 90 days following gazettal of Amendment No. 122 by the Minister for Planning.
Although Council's resolution from February 2012 relating to the CFP required a report on the CFP to be presented to Council for consideration in tandem with this report on Amendment No. 122, that has not been possible for the following reasons:
· Divergent landowner views have been expressed on several key aspects of the CFP and DCP Report. Those issues will only be resolved once the Minister for Planning has made a final determination on Amendment No. 122. The Minister's decision on Amendment No. 122 will provide a final ruling on these keys issues, thus providing certainty and clarity for the City to finalise both those documents.
· Through his final determination of Amendment No. 122, the Minister for Planning will determine the facilities to be included in DPS 2, for which the City will collect contributions. The CFP and DCP Report will then need to be brought into compliance with the Minister's decision on Amendment No. 122, within 90 days of gazettal of the Amendment. Hence, any attempts to finalise the CFP and DCP Report now, will only need to be reconsidered once the Minister's decision on Amendment No. 122 is known;
· Advice received from the Department of Planning supports the approach of Council considering adoption of the CFP and DCP Report following gazettal of Amendment No. 122.
In view of the preceding points, it will be recommended that Council agree to consider the CFP and DCP Report for final adoption, following gazettal of Amendment No. 122, rather than concurrently with Amendment No. 122, as resolved by Council in February 2012.
Consultation
Amendment No. 122 and the related DCPs and CFP were the subject of exhaustive consultation and collaboration with all affected landowners prior to and following Council's formal consideration of the Amendment in February 2012.
Following receipt of advice from the EPA that the Amendment did not require formal assessment, a 42-day public advertising period was carried out between 25 September 2012 and 7 November 2012 by way of:
· on-site signs;
· advertisements in the local newspaper for two consecutive weeks;
· a notice in Council offices and on the City’s website; and
· letters to affected and nearby landowners.
At the request of Capricorn Village Joint Venture (CVJV), the advertising period was extended by a further week to 14 November 2012.
During the public comment period (up to 14 November 2012) the City received twenty submissions. Of those, thirteen were from landowners or their representatives, six were from State Government departments, and one submission was received from a member of the general public.
Subsequent to the close of the formal public comment period, the City has continued to receive correspondence and feedback from landowners throughout Alkimos Eglinton and Yanchep Two Rocks on all aspects of Amendment No. 122 and the draft CFP and DCP Report. This has resulted in many new and additional issues being raised, which has made it difficult for Administration to identify a clear or unanimous landowner position on several aspects of the Amendment.
Administration met with Alkimos Eglinton landowners in February, April and May 2013 and with Yanchep Two Rocks landowners in February and April 2013 to discuss and clarify the key issues raised in their submissions and subsequent correspondence and to obtain feedback from landowners on Administration's preliminary responses to those issues.
Included as Attachment 2 is a summary of all submissions received during the formal advertising period of Amendment No. 122, together with Administration's comments and recommendations. Included as Attachment 3 is a summary of all other issues raised by landowners in correspondence since the close of the formal advertising period, together with Administration's comments and recommendations.
In summary, the comments received in respect of Amendment No. 122 do not specifically support or object to the amendment as a whole, but rather, highlight particular aspects of the Amendment that are supported, not supported or suggested to be changed by the persons making those submissions. In fact, many of the issues raised in the submissions and correspondence received actually relate to the draft CFP and DCP Report, rather than the amending text to be inserted into DPS 2 by Amendment No. 122. For the reasons explained in the 'Detail' section of this report, these issues are intended to be addressed through Council's subsequent consideration (for final adoption) of the CFP and DCP Report, following determination of Amendment No. 122 by the Minister for Planning.
The seven key issues raised by landowners, which specifically relate to Amendment No. 122 are:
i) Term of operation;
ii) Additional facilities;
iii) Methodology for cost contributions;
iv) Cost and scope;
v) Land acquisition;
vi) Landowner consultation; and
vii) Splitting of Yanchep and Two Rocks.
These seven key issues are discussed in detail in the 'Comment' section below. Further detail is contained in Attachments 2 and 3.
Comment
1. Term of Operation
Amendment No. 122 proposed that the Alkimos Eglinton and Yanchep Two Rocks DCP's would both operate for 20 years. This was the maximum timeframe likely to be supported by the Western Australian Planning Commission (WAPC) but was shorter than the expected completion of residential development in both areas (around 30 years for Alkimos Eglinton and 50 years for Yanchep Two Rocks).
The Alkimos Eglinton landowners have since unanimously agreed that the DCP for that area should be extended to 25 years to capture all proposed facilities in a single contribution period. All the Alkimos Eglinton landowners agreed that they would nearly all be operating from now until the end of the 25 year time period and therefore it was unnecessary to fragment the time period.
By increasing the Alkimos Eglinton DCP timeframe from 20 years to 25 years, the number of facilities provided will increase from 6 to 13 (if two new skate facilities are included, or 12 if not), with the estimated value of those facilities increasing from approximately $47 million to $87 million. Included as Attachment 4 is a table illustrating the resultant changes to the number and timing of facilities now proposed in Alkimos Eglinton over a 25 year DCP.
Conversely, the Yanchep Two Rocks landowners have expressed a strong preference for a shorter DCP timeframe of 10 years. Some of the Yanchep Two Rocks landowners are developing now and will be finished within 10 years, whilst other landowners will not even commence for at least 10 years. By adopting a 10 year DCP time frame there will be a clear nexus between infrastructure provided and demand created by development.
Administration acknowledges this issue and recognises that regardless of whether the DCP timeframe is 20 years or 10 years, because development is expected to continue in the Yanchep Two Rocks area for another 50 years, additional DCPs will be required should Council wish to continue collecting contributions for facilities required beyond the initial DCP timeframe.
By reducing the Yanchep Two Rocks DCP timeframe from 20 years to 10 years, the number of facilities provided will reduce from 8 to 3, with the estimated value of those facilities reducing from approximately $53 million to $19 million, if the Yanchep District Open Space is not acquired, or around $29 million, if the Yanchep District Open Space is acquired. Included as Attachment 5 is a table illustrating the resultant changes to the number and timing of facilities now proposed in Alkimos Eglinton over a 25 year DCP.
Administration supports increasing the Alkimos Eglinton DCP timeframe to 25 years and reducing the Yanchep Two Rocks DCP timeframe to 10 years, as requested by landowners. This will alter the advertised draft contribution rates for each area because contributions would then be collected over a longer or shorter period at a rate that fully covers the costs of delivering all facilities planned within that 25-year or 10-year period. The estimated impact on contribution rates for each DCP area is discussed in the 'Financial Implications' section of this report.
2. Additional Facilities
The Alkimos Eglinton landowners initially requested the inclusion of the following additional facilities in the DCP and Schedule 19 of Amendment No. 122:
· Changerooms in Alkimos;
· Changerooms and land for playing fields in Eglinton;
· Bowling greens and associated clubrooms in Alkimos and Eglinton;
· Skate facilities in both Alkimos and Eglinton.
In subsequent discussions between landowners and Administration, it was noted that:
· The changerooms in Alkimos are considered to be neighbourhood level facilities associated with a neighbourhood level open space and therefore below the scope of the DCP which targets district level facilities only.
· The suggested land for playing fields in Eglinton is depicted in the Eglinton LSP No. 82, and arguably would not have a district-level function. Likewise, the suggested changerooms on that site would potentially be below the scope of the DCP. The suggestion for these additional facilities to be included in Amendment No. 122 has since been withdrawn.
· The suggested bowling greens and clubrooms are sport-specific facilities that need to be justified by a needs analysis and feasibility study involving other relevant stakeholders. The suggestion these additional facilities to be included in Amendment No. 122 has therefore since been withdrawn.
· The suggested skate facilities in Alkimos and Eglinton are considered to be district-level multipurpose facilities that would meet an important need in a growing community, particularly one with a large proportion of younger people and young families.
Since these points were discussed with Alkimos Eglinton landowners, those landowners have more recently advised Administration that they no longer support any of the additional facilities mentioned above being included in the DCP. Nevertheless, it is Administration's view, for the reasons previously discussed with landowners, that a skate facility in either Alkimos or Eglinton would serve a district-level function and cater for the needs of the community in that area. Accordingly, it will be recommended that a single skate facility be provided in Alkimos or Eglinton and included in Schedule 19 of Amendment No. 122.
If this facility is ultimately included in the gazetted version of Amendment No. 122, following final determination by the Minister for Planning, then it will also need to be included in the CFP and DCP Report.
3. Methodology for cost contributions
Alkimos Eglinton landowners supported the 'per hectare' approach to calculating a landowner's cost contribution, but raised some issues in relation to determining the 'developable area' on which contributions would be based.
A landowner's developable area is proposed to be calculated by deducting a number of statutory (i.e. regional reserves and industrial zoned land) and non-statutory exclusions (un-developable land uses and non-residential land uses).
Landowners were concerned that while a standard deduction for non-residential land uses was a reasonable approach in predominantly residential zoned land, there were significant areas of City Centre land in the DCP area that, although having a residential component, needed to be treated differently. As a consequence, Alkimos Eglinton landowners are in the process of more accurately calculating their developable areas based on Local Structure Plans. This detail will need to form part of the DCP once finally adopted by Council after gazettal of Amendment No. 122, but does not require any change to the advertised text of Amendment No. 122.
Yanchep Two Rocks landowners were not unanimous in their views on the cost contribution methodology, with some landowners favouring a 'per hectare' approach and others preferring a 'per dwelling' approach. However, the majority of Yanchep Two Rocks landowners did prefer a 'per dwelling' approach.
Administration acknowledges the difficulties associated with defining the developable area of land in Yanchep Two Rocks, which would be required to administer a 'per hectare' contribution rate. This is largely due to the substantial size of the area, the estimated 50-year timeframe for full build-out, and the absence or immaturity of Local Structure Planning for much of the area (compared to Alkimos Eglinton). Administration will therefore be recommending a 'per dwelling' approach for the Yanchep Two Rocks DCP, instead of the advertised 'per hectare' approach. This will require a change to the calculation methodology described in the new Schedule 20 of the advertised version of Amendment No. 122.
4. Cost and Scope
Both Alkimos Eglinton and Yanchep Two Rocks landowners requested that more detail be included in proposed Schedules 19 and 20 to describe the scope of all facilities to be provided in each DCP. Landowners were concerned that the scope and composition of each facility could change over time, which in turn could increase cost contributions.
Landowners were apprehensive that Council could increase contribution rates to fund expanding facility scope instead of reducing the scope of each facility to match contributions that have been collected.
Some landowners suggested specific details be included in Schedules 19 or 20 for each facility, such as the timing of delivery, precise maximum floor areas, number of rooms, number of car parking bays and the like. Much of this detail is presently included in the CFP and DCP Report.
Administration does not support including precise facility details in the Scheme text, as any changes to these details in future would then necessitate an amendment to the Scheme. However, Administration does agree that Schedules 19 and 20 should provide some indication of the purpose and key elements of each facility, including land acquisition where that is proposed.
To further address landowner sentiments, Administration will also be recommending changes to Clause 11 of the amendment text, to introduce an additional consultation step for landowners to be more involved in the annual review of each DCP. This will provide landowners with the opportunity to scrutinise the scope and therefore cost estimates for each facility on a regular and ongoing basis, and to provide feedback to Council on whether and how the scope of facilities might be altered to keep contribution costs to a minimum while still satisfying community needs.
In addition to the above, landowners have commented that any grant funding received in future for community facilities, should be credited towards the cost of the facility rather than used to increase the scope of facilities, thereby reducing the contribution rate paid by developers. In response to this, Administration will recommend that a new principle of this sort be included in the text of Amendment No. 122.
Landowners have also commented that Administrative costs should be clearly defined and itemised, in order for landowners to review those costs. Amendment No. 122 did not include administrative cost estimates because at the time of preparing the amendment documentation these costs were not (and still are not) known. These costs will be calculated and included in the final DCP Report to be adopted by Council.
Included as Attachment 6 is a table illustrating the status of agreement or consensus reached with Alkimos Eglinton landowners on the scope of each facility proposed in that DCP area. The scope of each facility is outlined in the CFP and DCP Report, not in Amendment No. 122, so any currently unresolved scope issues will need to be addressed in the final CFP and DCP Report adopted by Council following gazettal of Amendment No. 122.
5. Land Acquisition
The Alkimos Eglinton and Yanchep Two Rocks DCPs both include estimated land acquisition costs for facilities such as libraries and community centres, where those facilities cannot otherwise be located on Foreshore Reserves, Regional Reserves and land given up for Public Open Space (POS). The exception to this is the proposed land acquisition for the Yanchep District Open Space, which was always proposed as an incentive to the developer (Yanchep Beach Joint Venture) to facilitate the early delivery of that facility, ahead of when the land might otherwise be given up free of charge by the developer as part of their normal subdivision obligations.
Despite originally expressing their strong opposition to the acquisition of the Yanchep District Open Space (during the formal advertising period), most affected Yanchep Two Rocks landowners have now expressed their support for that acquisition, either in full or 'in principle'.
One landowner (Yanchep Sun City Pty Ltd) has recently commented that while it supports the use of DCP funds to acquire land for the Yanchep District Open Space, it believes that the cost and responsibility for doing so should rest with both the City and developers, rather than being borne entirely by the DCP. Administration disagrees that the City should co-fund the acquisition of this land, because Council has already agreed to contribute financially to delivering this project through its various past decisions on deed negotiations with YBJV.
Although Yanchep Sun City Pty Ltd has stated that the DCP should not fund 100% of the proposed acquisition of land for the Yanchep District Open Space, there is no 'need and nexus' justification provided by that landowner as to why developments occurring in Yanchep Two Rocks should contribute less than 100% towards the cost of the Yanchep District Open Space acquisition, when those same developments would be contributing to 100% of the cost of constructing the facility.
More recently, a group of Yanchep Two Rocks landowners (Australand Property Group, Peet Yanchep Land Syndicate, Peet Yanchep P/L, GMPM (Fini Group), and P&N Landreach) have written to the City stating that the landowners support "in principle" the Yanchep Two Rocks DCP being used to purchase "POS only in excess of the 10% allocation" but that the "terms of the proposed sale of the Yanchep District Open Space" need to be provided to them before they can reach a final position. The letter goes on to request that the City provide "further details regarding the terms of commercial arrangements entered into with Yanchep Beach Joint Venture...before full support can be given for Amendment No. 122".
Administration has responded to this letter, raising several practical issues and questions, including:
1. How would the City calculate the amount of POS to be provided in Yanchep and Two Rocks, given that State and Commonwealth environmental approvals play a significant part in determining the amount of POS to be provided by developers, often regardless of what is proposed in adopted Structure Plans?
2. Would the DCP acquire POS from all landowners in Yanchep and Two Rocks only when the actual amount of POS given up by each respective landowner reaches and then exceeds the minimum 10% obligation, or by some other means or at some other stage?
3. The "terms of commercial arrangements" between the City and Yanchep Beach Joint Venture (YBJV) have not yet been determined or agreed by Council. Only once Council formally and finally decides to execute a deed of agreement with YBJV to deliver the Yanchep District Open Space project, will the "terms" of that arrangement be known; and even then, Council will need to itself decide whether and how to disclose the details of that arrangement. At its Special Council Meeting on 10 April 2013, Council resolved, among other things (Item SCR02-04/13) – "2. NOTES that it has not been possible to finalise a Deed of Agreement with Yanchep Beach Joint Venture for the early delivery of the Yanchep Active Open Space, pending the gazettal of Amendment No. 122 of the City of Wanneroo District Planning Scheme No. 2, dealing with the introduction of the Development Contribution Plan". Hence, Council will only be in a position to execute an agreement with YBJV (and the terms of that agreement will only be determined) once Amendment No. 122 is gazetted.
4. What "further details" (regarding the arrangement with YBJV) are landowners seeking, given that the precise details have not yet been determined and given the City's 'principles' which are to form the basis of any agreement with YBJV, have been determined by various Council decisions in the past and the (previously confidential) reports relating to those decisions have now been made publicly available by Council?
Administration does not believe the 'in principle' approach suggested in the above-mentioned letter can be seriously entertained, because it is entirely lacking in detail and is stated as being conditional upon those landowners being provided with 'further details' of the agreement between the City and YBJV and reserving their final position on the matter until they have considered those details. So it cannot be assumed that the 'in principle' support recently offered by those landowners would ultimately represent support at all.
It is understood that Council would not be in a position to execute an agreement with YBJV until after Amendment No. 122 has been gazetted, meaning the landowners' final position would not be known until then. In that case, Council would need to determine whether the land acquisition for the Yanchep District Open Space is included or excluded in the cost of that facility when it considers the DCP for final adoption.
Administration also has concerns regarding the practicalities and risks associated with implementing the 'in principle' approach suggested by some Yanchep Two Rocks landowners, as it would be virtually impossible for the City to predict with any accuracy, how much POS is going to be given up in Yanchep Two Rocks over the 10-year DCP timeframe. The City would need to maintain a detailed register of the amount of POS given up by each original 'parent lot' in order for the acquisition to be triggered once more than 10% of the original parent lot is given up as POS. However, parent lots are rarely preserved and are typically fragmented into several 'super lots', which are then further subdivided and/or sold, thus making it difficult to determine the beneficiary of any payment for the provision of more than 10% POS.
Another problem with this approach is that it could be open to exploitation by some landowners choosing to provide substantially more than 10% POS for marketing and sales purposes, on the basis that other landowners (together with the subdividing landowner themself) would effectively pay for or subsidise their 'over-provision'.
Local Structure Plans cannot be relied upon to calculate how much land needs to be acquired for the over-10% provision of POS, because those plans can and do change over time and although a structure plan proposes land to be set aside for POS, that does not guarantee that will occur within the 10-year DCP timeframe now proposed for Yanchep Two Rocks, if at all.
For the reasons set out below, Administration will be recommending that the land acquisition cost for the Yanchep District Open Space be included in Schedule 20 as a DCP cost for that facility, consistent with the advertised draft DCP Report and CFP:
· The Yanchep Two Rocks landowners have expressed changing and conflicting views on the acquisition of land for the Yanchep District Open Space and have been unable to establish a clear, consistent or unanimous position on the matter among themselves.
· The only alternative approach suggested by some landowners (i.e. the over-10% principle mentioned earlier) provides no detail, would be unworkable, impractical and cannot be seriously entertained by Administration;
· Despite criticisms by some landowners about this land acquisition component being included as a DCP cost, those landowners who previously expressed their strong opposition to the acquisition (during the formal submission period), appear to have now largely softened their position in favour of the land acquisition proceeding in one form or another. The exception to this is Capricorn Investment Group Pty Ltd, which is a 50% owner of CVJV, which has expressed its opposition to DCP funds being used to acquire land for the Yanchep District Open Space;
· No other Yanchep Two Rocks landowner has come forward to voluntarily cede their land free of cost to facilitate the early provision of an alternative active open space facility. The fact remains that active open space serving a district-level function will be required in Yanchep Two Rocks within the next 10 years, but the provision of such facilities depends entirely on the land being given up free of cost through the normal subdivision process. If the staging of subdivision occurs in areas remote from designated district-level facilities, then either the facility will not be provided, or the landowner will need to voluntarily cede that land free of cost ahead of when that would otherwise occur through the subdivision process, or the City would need to acquire the land. The City cannot deliver any community facilities under the DCP until or unless land is available upon which to develop those facilities. The divergent landowner views on this matter do not change that fact.
Despite the comments received from landowners in relation to the acquisition of the Yanchep District Open Space, the actual text of Amendment No. 122 does not presently include any details of land that is to be acquired under either DCP, because that information is contained in the corresponding DCP Report, which only needs to be adopted by Council within 90 days following gazettal of Amendment No. 122, not concurrently with Amendment No. 122. However, as stated earlier, it will be recommended that any proposed land acquisition be included in Schedules 19 and 20 of Amendment No. 122.
If no change is made to the text of Amendment No. 122 to specifically reference acquisition of the Yanchep District Open Space (and any other acquisition proposed by either DCP), then Council will be able to decide whether the land cost is included or excluded in the cost of that facility when it considers the DCP for adoption after gazettal of Amendment No. 122, rather than as part of its consideration of Amendment No. 122. However, in considering Amendment No. 122 the Minister may require that it include certain additional details for each facility (such as land acquisition), in which case the Minister's decision would be final and Council's adopted DCP would need to align with the Minister's decision.
6. Landowner Consultation
The Alkimos Eglinton and Yanchep Two Rocks landowners have both sought to be more closely involved in the review and administration of the DCPs, particularly in terms of monitoring the scope of facilities and the future costs of those facilities. To address these comments, Administration will be recommending changes to clause 11.0 of the Amendment No. 122 text, to provide additional consultation steps for landowners to become more involved in the review process before any decision is made by Council to adjust costs.
7. Splitting of Yanchep and Two Rocks
Some Yanchep Two Rocks landowners have argued that Yanchep and Two Rocks should be split into two separate DCP areas, on the basis that (for the next 10 years) developments in Two Rocks will be making payments towards facilities in the DCP, but none of those facilities are planned for Two Rocks in the initial 10-year DCP timeframe. The landowners arguing this point have stated that developments in Two Rocks should only have to contribute to facilities that are planned to be delivered in Two Rocks in a later DCP period and that developments in Two Rocks should not be subject of a DCP and cost contributions.
Administration is opposed to the notion of splitting Yanchep and Two Rocks into two separate DCPs because only those landowners who develop in Two Rocks over the next 10 years could reasonably argue that they might not substantially or immediately benefit from being included in the Yanchep Two Rocks DCP, given that all the facilities planned within that period would be located in Yanchep.
However, there is another side to that argument, insofar as residents living in new Two Rocks developments would need to use the Yanchep facilities (and should therefore contribute to them) if no other facilities are planned for Two Rocks in the next 10 years. The strength of the argument to split Yanchep and Two Rocks would diminish over time as the DCP approaches its tenth year and would be further eroded by the following key facts:
· Payment of contributions is only triggered by subdivision/development occurring, so only those developers who subdivide and therefore contribute to an increase in population (and demand) would be required to make payments towards the DCP;
· Yanchep and Two Rocks are included in the same District Structure Plan and so should be included in the same district-level DCP;
· Yanchep and Two Rocks are not so geographically remote from each other to justify being split from the outset;
· The use of facilities throughout the Yanchep Two Rocks area will not be limited to facilities within the catchment of the contributing land;
· The premise of the DCP is not to 'benefit' contributing landowners in terms of marketing or sales opportunities to promote access to new or future facilities. Rather, the DCP requires developers to pay for the facilities that will be required to cater for the needs of their purchasers/residents.
Statutory Compliance
Amendment No. 122 has been prepared and processed in accordance with the Planning and Development Act 2005 and Town Planning Regulations 1967.
In accordance with Regulation 17(2), Council is required to consider the submissions received in respect of Amendment No. 122 and must resolve to either (a) adopt the amendment with or without modification, or (b) not proceed with the amendment.
Further, pursuant to Regulation 18(1), within 28 days of the passing of that resolution, the City must provide the WAPC with (among other things) a schedule of submissions and Council's recommendation and response to the submissions, together with particulars of any modifications recommended to the amendment. In this regard, Council may only 'recommend' changes to Amendment No. 122 to the WAPC and Minister and will not itself be entitled to make any changes to the advertised version of Amendment No. 122.
Following Council's determination of Amendment No. 122, the Amendment documentation will need to be signed and sealed by the Mayor and CEO and forwarded to the WAPC for consideration. The WAPC is not bound by any timeframe within which it must consider Amendment No. 122. It is unlikely that the City will be notified of the WAPC's recommendation to the Minister. The Minister's decision on Amendment No. 122 will be final.
Strategic Implications
The proposal accords with the following Outcome Objective of the City’s Strategic Plan 2006 – 2021:
“2 Social
2.2 Improve the City’s identity and community well-being through arts, culture, leisure and recreation”
Policy Implications
Local Planning Policy 3.3: Northern Coastal Growth Corridor Development Contributions (LPP 3.3) outlines an interim arrangement for development contributions agreed to by all landowners affected by Amendment No. 122. The interim arrangement involves the payment of cost contributions at an agreed rate per lot by land developers in the Alkimos Eglinton and Yanchep Two Rocks DCP areas, until such time as Amendment No. 122 is gazetted.
Following Council's decision on Amendment No. 122, Administration will submit a separate report to Council to consider initiating an amendment to LPP 3.3 (for the purpose of public advertising), to revise the interim development contribution rate for both DCP areas, to reflect the higher likely contribution rate to be applied when Amendment No. 122 is finally gazetted.
Financial Implications
The changes that will be recommended to Amendment No. 122 will:
· Increase the collection period for Alkimos Eglinton from 20 years to 25 years, with the number of facilities increasing from 6 to 13 (if two skate facilities are provided, or 12 if not), with the estimated cost of facilities increasing from around $47 million to $87 million; and
· Reduce the collection period for Yanchep Two Rocks from 20 years to 10 years, with the number of facilities reducing from 8 to 3., with the estimated cost of facilities increasing from around $53 million to $19 million (if the Yanchep District Open Space is not acquired) or approximately $29 million (if the Yanchep District Open Space is acquired).
The impact of these changes on the estimated contribution rate for each DCP area is shown in Attachment 7 (Alkimos Eglinton) and Attachment 8 (Yanchep Two Rocks).
As an overarching principle, Administration has aimed to stage the timing and type of facilities to be delivered in each of the DCPs with the collection of contributions to pay for those facilities at the times when they will be demanded by the future population of the area, in an attempt to minimise or avoid the need for borrowings. This principle is illustrated in the graphs contained in Attachment 9 (Alkimos Eglinton) and Attachment 10 (Yanchep Two Rocks), which depict the projected annual contributions received against the forecast balance in each DCP reserve account based on expenditure associated with delivery of each facility.
By implementing a contribution arrangement and collecting contributions, Council is committing to the delivery of the facilities identified in the DCP at the times specified therein (subject to population and land availability), and takes on the risks associated with this, including potentially having to make up any shortfall in funding at the time of construction and/or to construct the facility at the required point in time, regardless of whether sufficient funds have been collected at that time to do so. In any event, the administration of the DCPs will be managed closely to ensure it is ‘cost-neutral’ to the City, with any additional or borrowing costs incurred by Council (including interest on any new loans) being recouped through ongoing annual reviews of both DCPs.
Contributions are required to be deposited into a reserve account until they are required, and may only be used for the purposes outlined in the DCPs. Surplus funds at the end of the life of the DCP must be either returned to those developers that paid the funds or, where that is not possible, used to fund the provision of additional facilities or improvements in the relevant development contribution area. All interim development contributions received to date, in accordance with LPP 3.3, have been held in reserve accounts dedicated to each DCP area. The reserve account for Alkimos Eglinton currently contains approximately $1.7 million dollars in collected contributions, while the Yanchep Two Rocks reserve account contains approximately $183,000 in collected contributions.
It should be noted that developer contributions can only be used to fund the acquisition of land (where necessary) and construction of new community facilities and not for operating costs associated with the City’s running of these facilities. As such, those operating costs will need to be factored into the City’s 10 year financial plan and relevant annual budgets in future.
Further, it should also be noted that cost estimates included in the DCP documentation will, within 90 days following gazettal of Amendment No. 122, need to be indexed and reviewed to reflect construction costs at the time of gazettal, advertised publicly and subsequently endorsed by Council prior to being implemented.
Voting Requirements
Simple Majority
|
Recommendation That Council:-
1. NOTES the summary of submissions received in respect of Amendment No. 122 to District Planning Scheme No. 2 contained in Attachment 1 and the summary of additional comments contained in Attachment 2, ENDORSES Administration's comments and recommendations contained therein, FORWARDS those Attachments to the Western Australian Planning Commission for its consideration in respect of Amendment No. 122 and ADVISES submitters of its decision;
2. Pursuant to Town Planning Regulation 17(2)(a) ADOPTS Amendment No. 122 to District Planning Scheme No. 2, as advertised for public comment and set out in Attachment 1 and RECOMMENDS the following modifications to the Western Australian Planning Commission and Minister for Planning:
Schedule 18
a) Inserting the following additional principle in Clause 6.0:
"(i) Funding
Grants and alternative funding sources should be secured where possible, and any cost savings resulting from confirmed funding sources should in the first instance, where practicable, be credited to the development contribution plan rather than used to expand the scope of infrastructure or infrastructure costs."
b) Insert new sub-clauses 11.4 to 11.7 as follows:
"11.4 The local government's review of estimated costs, carried out in accordance with clause 11.2, shall recommend that the estimated costs are to be:
(a) maintained; (b) reduced; or (c) increased.
11.5 Where the review of estimated costs recommends those costs be maintained or reduced, pursuant to clauses 11.4(a) or (b), then the local government shall decide to either maintain or reduce the estimated costs and shall notify owners of its decision.
11.6 Where the review of estimated costs recommends those costs be increased pursuant to clause 11.4(c), then the local government shall in writing invite comment on the proposal from owners for a period of not less than 28 days, prior to making any decision to increase the estimated costs.
11.7 The local government shall consider all submissions received and within ninety (90) days of the date of the latest date specified in the notice given under clause 11.6, decide that the estimated costs are to be:
(a) maintained; or (b) increased and if so the degree of that increase.
The local government shall notify affected persons of its decision."
c) Amend existing sub-clause 11.4 (a) to read as follows:
"is to adjust the cost contribution of any owner in accordance with the revised estimated costs determined in accordance with clauses 11.5 or 11.7; and"
d) Delete existing sub-clause 11.5;
e) Re-number existing clauses 11.4, 11.6 and 11.7 as clauses 11.8, 11.9 and 11.10 respectively.
f) Amend sub-clause 13.2(b) to read as follows:
"the commencement of any development on the owner’s land within the development contribution area with the exception of clearing and earthworks commenced under a Development Approval in the case of land subdivisions;"
g) Insert a new sub-clause 16.4 as follows:
"The local government may (but is not obliged to do so) raise loans or provide funds from other sources for the purpose of providing the finance necessary for the implementation of the infrastructure costs specified in the development contribution plan and any interest or charges incurred in doing so will be deemed to be an infrastructure cost."
Schedule 19
h) In the "Infrastructure and administrative items to be funded" row of the table, delete the facilities listed under the "District Facilities" heading and replace them with the following:
" · Surf Life Saving Club, Alkimos South Coastal Village – facility to support surf life saving operations and associated activities, including:
o Planning, design and project management costs; o Site, servicing and construction costs.
· Public Open Space (Active), Alkimos Regional Parks and Recreation Reserve – playing fields and associated infrastructure to support sporting and recreational uses, including:
o Planning, design and project management costs; o Site, servicing and construction costs.
· Multipurpose Hard Courts, Alkimos Regional Parks and Recreation Reserve – fenced hard courts facilities and associated amenity to support a variety of court sports, including:
o Planning, design and project management costs; o Site, servicing and construction costs.
· Library, Alkimos Secondary Centre – facility to support the storage and community access to printed and electronic media and associated community meetings and activities, including:
o Planning, design and project management costs; o Land acquisition costs; o Site, servicing and construction costs.
· Community Centre, Alkimos Secondary Centre – facility to support community meetings, gatherings and associated activities, including:
o Planning, design and project management costs o Land acquisition costs; o Site, servicing and construction costs.
· Indoor Recreation Centre, Alkimos Secondary Centre – facility to support indoor recreation and sporting activities, including:
o Planning, design and project management costs; o Land acquisition costs; o Site, servicing and construction costs.
· Skate Park, Alkimos Eglinton District – facility to support skateboard, BMX and other wheeled sport activities, including:
o Planning, design and project management costs; o Site, servicing and construction costs.
· Public Open Space (Active), Eglinton District Centre - playing fields and associated infrastructure to support sporting and recreational uses, including:
o Planning, design and project management costs; o Site, servicing and construction costs.
· Multipurpose Hard Courts, Eglinton District Centre – Fenced hard courts facilities and associated amenity to support a variety of court sports, including:
o planning, design and project management costs; o Site, servicing and construction costs.
· Indoor Recreation Centre, Eglinton District Centre – Facility to support indoor recreation and sporting activities, including:
o Planning, design and project management costs; o Land acquisition costs; o Site, servicing and construction costs.
· Community Centre, Eglinton District Centre – facility to support community meetings, gatherings and associated activities, including:
o Planning, design and project management costs; o Land acquisition costs; o Site, servicing and construction costs.
· Library, Eglinton District Centre – facility to support the storage and community access to printed and electronic media and associated community meetings and activities, including:
o Planning, design and project management costs; o Land acquisition costs; o Site, servicing and construction costs.
Contributions shall be payable for the initial district facility only. No contributions shall be payable for any future upgrade of a district facility to regional standard."
i) In the "Period of operation" row of the table, delete "20" and replace it with "25".
Schedule 20
j) In the "Infrastructure and administrative items to be funded" row of the table, delete the facilities listed under the "District Facilities" heading and replace them with the following:
" · Surf Life Saving Club, Yanchep Lagoon – facility to support surf life saving operation and associated activities, including:
o Planning, design and project management costs; o Site, servicing and construction costs.
· Coastal Node Facilities, Capricorn Coastal Node – facilities and amenity to support community use and enjoyment of coastal node areas, including:
o Planning, design and project management costs; o Site, servicing and construction costs.
· Public Open Space (Active), Yanchep Metropolitan Centre - playing fields and associated infrastructure to support sporting and recreational uses, including:
o Planning, design and project management costs; o Land acquisition costs; o Site, servicing and construction costs.
Contributions shall be payable for the initial district facility only. No contributions shall be payable for any future upgrade of a district facility to regional standard."
k) In the "Method for calculating contributions" row of the table, delete all text after the sentence "The methodology for determining contributions is in accordance with the following formula:" and replace it with the following:
" CC = TC x NDU TDU Where: CC = Landowner's Cost Contribution Amount ($) TC = Total cost of delivering community facilities + Total Administrative Costs ($) NDU = Number of additional lots proposed to be created as part of a proposed subdivision; and the number of dwellings proposed to be created as part of an application for planning approval, other than the first dwelling. TDU = Total number of dwellings expected within the DCA."
l) In the "Period of operation" row of the table, delete the number "20" and replace it with the number "10".
3. Pursuant to Town Planning Regulations 22 and 25 AUTHORISES the affixing of the common seal to, and endorses the signing of, the Amendment documentation by the Mayor and Chief Executive Officer; and
4. FORWARDS the Amendment documentation to the Western Australian Planning Commission for its consideration REQUESTING the Hon Minister for Planning grant final approval to the Amendment, subject to the modifications listed in 2. Above.
|
|
1. |
Advertised Amendment No. 122 text and maps |
13/81909 |
Minuted |
|
2. |
Attachment 2 |
13/88501 |
Minuted |
|
3. |
Attachment 3 |
13/88505 |
|
|
4. |
Attachment 4 |
13/88454 |
|
|
5. |
Attachment 5 |
13/88463 |
|
|
6. |
Attachment 6 |
13/88468 |
|
|
7. |
Attachment 7 |
13/88470 |
|
|
8. |
Attachment 8 |
13/88472 |
|
|
9. |
Attachment 9 |
13/88474 |
|
|
10. |
Attachment 10 |
13/88477 |
|