BRIEFING PAPERS
FOR ELECTED MEMBERS’
BRIEFING SESSION
Draft Only
to be held at
the Council Chambers
Civic Centre
on 14 June, 2016 commencing at 6.00pm
BRIEFING PAPERS
FOR ELECTED MEMBERS’
BRIEFING SESSION
Draft Only
to be held at
the Council Chambers
Civic Centre
on 14 June, 2016 commencing at 6.00pm

Briefing Papers for Tuesday 14 June, 2016
CONTENTS
5.2 Financial Activity Statement for the Period Ended 30 April 2016
5.3 Financial Activity Statement for the Period Ended 31 May 2016
CITY OF WANNEROO Late Items Agenda OF Elected Members' Briefing Session 14 June, 2016 2
Late Items Agenda
File Ref: 23374 – 16/148014
Responsible Officer: Director Corporate Strategy and Performance
Disclosure of Interest: Nil
Attachments: 5
Issue
To consider the Financial Activity Statement for the period ended 30 April 2016.
Background
In accordance with Local Government Regulations, the Financial Activity Statement has been prepared in compliance with the following:
1. Regulation 34(1) of the Local Government (Financial Management) Regulations 1996, which requires a local government to prepare a statement of financial activity each month, presented according to nature and type, by program, or by business unit. For the 2015/16 financial year Council will present the statement of financial activity by nature and type.
2. Regulation 34(5) of the Local Government (Financial Management) Regulations 1996, which requires a local government to adopt a percentage or value, calculated in accordance with Australian Accounting Standards, to be used in statements of financial activity for reporting material variances. For the 2015/16 financial year Council will use 10% for the reporting of variances.
Detail
YEAR TO DATE RESULT FROM OPERATIONS
Overall Comment
The Result from Operations for the City to April month-end presents an overall favourable variance of +$15.0m (+76%) to YTD budget. Operating Revenue presented a favourable variance to YTD budget of +$2.7m (+2%). Expenditures from Operations also present a favourable variance of +$12.3m (+9%), with the main contributors being Materials & Contracts (+$8.0m) and Employee Costs (+$4.0m).
Consultation
Analysis of results has been undertaken in consultation with Directorate Managers.
Comment
The revised budget figures within this report are inclusive of the Mid-Year Review.
Below is a table which highlights the financial activity for the month of April 2016. Included in the table are the month’s revenues and expenditures by category, with corresponding budgets and variances.
In accordance with the requirement of Regulation 34(5) of the Local Government (Financial Management) Regulations 1996, the commentaries on 10% variances to budget in the Financial Activity Statement for the period ended 30 April 2016 are provided below.
CURRENT MONTH
The below table highlights the operating performance for the City of Wanneroo for the month of April and identifies variances to budget for each category of income and expense. The following colours have been used to categorise levels of variance:
· Green >+10%
· Orange <+/-10%
· Red >-10%
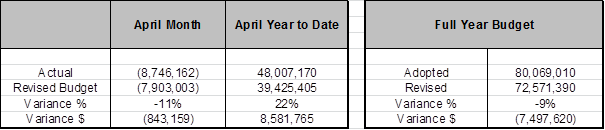
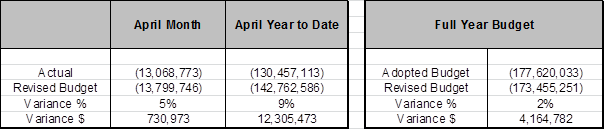
The month of April produced an overall unfavourable net result variance of -11% (-$0.8m).
Operating Revenues showed a negative variance of -$252k (-7%). Although there was a positive variance in Rates, it was offset by unfavourable variances in the categories of Operating Grants, Subsidies and Contributions (through lower than budgeted State Grant receipts), Fees and Charges (mainly attributed to lower User Entry Fee income and Application Licence Fee income) and Interest Earnings through lower non-payment penalty receipts.
Operating Expenses displayed a positive variance of $0.7m (+5%). The more material contributors to this variance were Depreciation (+$0.5 million), Employee costs (+$166k) mainly through lower wage expenses coupled with reduced levels of training course expenditure, and Material expenses (+$148k) predominantly in contract expenses and refuse removal expenses.
Other Revenue & Expenses produced an unfavourable variance of -$1.3m (-62%) which was mainly attributed to Town Planning Schemes and Asset Disposals. Town Planning Scheme revenues and expenses are accounted for when a cell has received income or the project expenses have been incurred. The timing of the income and expense is difficult to predict as work undertaken is not under the City’s direct control.
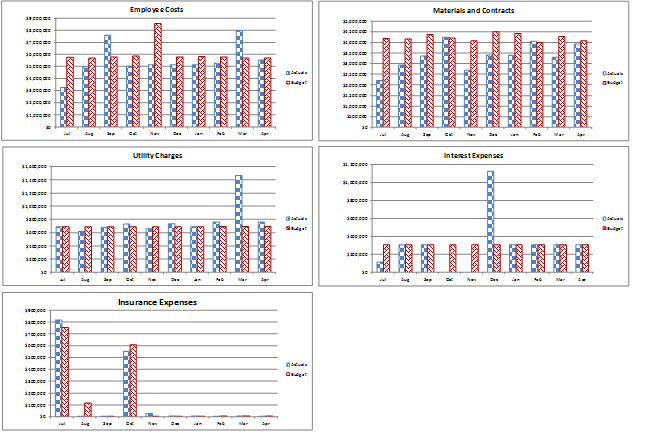
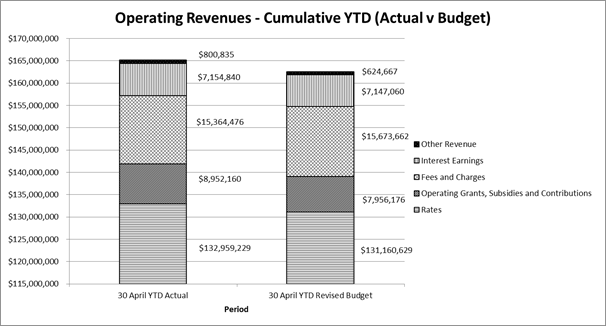
The graphs below illustrate the various operating income categories for each month and are compared against their respective monthly budgets. Rates have been excluded as almost the entire income amount for this category is received in one month. Rates income is presented in a graph further in this report titled “Operating Revenues – Cumulative YTD (Actual vs Budget)”.
The following graphs represent the operating expenditure for each month and are compared against their respective monthly budgets. As a non-cash expense, depreciation has been excluded from these graphs but is shown as part of the graph titled “Operating Expenses – Cumulative YTD (Actual vs Budget)”.
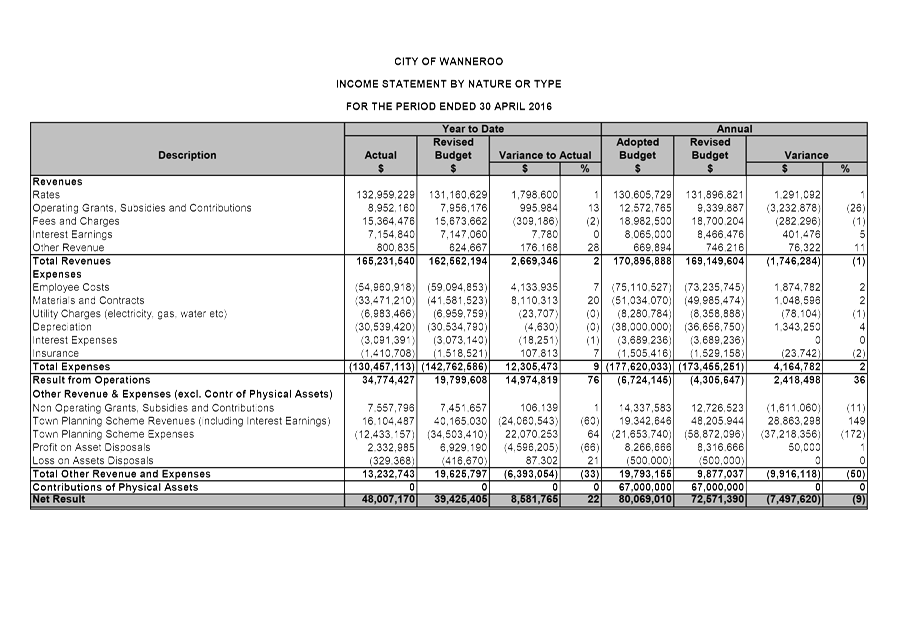
Income Statement (Refer to Attachment 1)
Year to Date Net Result
The year to date Net Result presented a favourable variance of +$8.6m (+22%). Details for the variances are outlined below.
Operating Revenues
The Year to April produced a positive variance of +$2.7m (+2%) comprising the following:
Operating Grants, Subsidies and Contributions (Actual $9.0m, Revised Budget $8.0m)
This income category shows a positive year to date variance of +13% (+$0.996m). The main contributor to the positive variance relates to the receipt of Mindarie Regional Council’s refund of carbon tax ($0.9m). A less substantial contributor to the variance is income relating to Immunisations and Street Lighting which amounted to +$89k.
Other Revenue (Actual $0.8m, Revised Budget $0.6m)
This income category shows a positive year to date variance of +28% (+$176k). The main contributor to the positive variance relates to various receipts (+$149k) relating to Developer Contribution preparation costs for the Alkimos/Eglington development and Coastal Management Plan Assistance Program Funding from the Department of Planning. Another less substantial contributor was receipt of an insurance rebate of $48k.
Operating Expenses
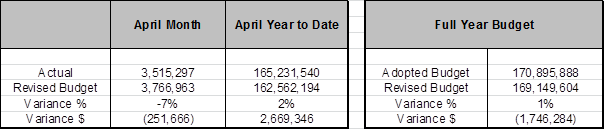
Operating Expenses to April present a positive variance of +$12.3m (+9%). The above table highlights the month, YTD and full budget results which are further expanded in the section below. As with Operating Revenue, a bar graph is also included allowing comparison of expenditure categories.
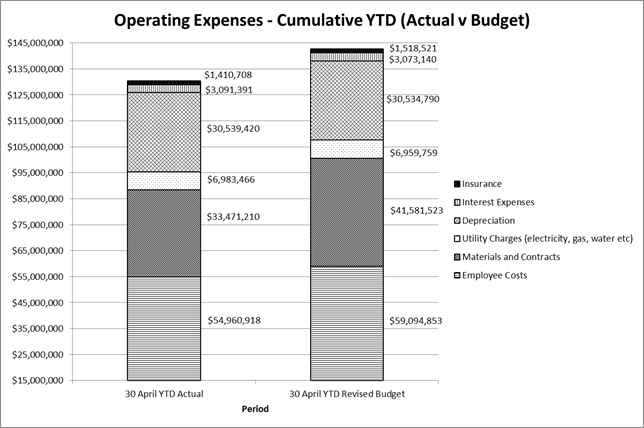
Materials and Contracts (Actual $33.5m, Revised Budget $41.6m)
The Materials and Contracts Expense category reflects a YTD variance of +20% (+$8.1m). The main contributor for this relates to Contract Expenses which produced a positive variance of +$5.2m and reflects favourable variances in the Maintenance of Parks and Reserves, Pavement Kerb, Sportsground, Bushland and various Land & Buildings.
Refuse Removal Expenses also resulted in a positive variance to April (+$0.9m). This primarily relates to Domestic Rubbish Collection however this was partially offset through higher than budgeted expenditure in Bulk Rubbish Collection.
Material Expenses have produced a positive variance of +$0.7m. This category covers a number of expenses of which the higher contributors to the variance include materials for Domestic Waste Plant Maintenance, Public Facility Rubbish and Litter Collection, Maintain Parks and Park Structures, Residential Road Land Maintenance, Maintain CCTV, Promote Council Image and Pavement Seal Maintenance. All of these areas have a combined positive variance of +$0.5m.
Consulting Fee Expenses showed a variance of +$0.7m reflecting under-spend in a number of service units. Consulting fees are budgeted on a monthly basis and are only incurred when required.
Fuel & Oil Expenses have also produced a positive variance to April (+$0.4m). This is largely contributed by the lower than anticipated fuel requirements within Waste Domestic Plant facilities as well as lower fuel prices.
Other Revenue and Expenses
Town Planning Scheme (TPS) Revenues (Actual $16.1m, Revised Budget $40.2m)
This category of income showed an adverse variance to April of -60% (-$24.1m). This is attributed to Lot Sale contributions across various TPS Cells. The Cells with YTD unfavourable variances are Cell 9 (-$21.1m), Cell 6 (-$1.4m), Cell 1 (-$0.748m), Cell 4 (-$0.7m), Cell 8 (-$0.7m) and Cell 7 (-$0.4m). However, these were marginally offset by Cells with favourable YTD activity were Cell 5 (+$0.6m), TPS No. 20 (+$292k) and Cell 2 (+$189k). As with TPS Expenses these categories of income do not impact the City’s municipal operations.
TPS Expenses (Actual $12.4m, Revised Budget $34.5m)
TPS Expenses for the year to April total $12.4m which has produced a favourable variance of 64% (+$22.1m) YTD. These expenditures relate to specific costs and land purchases within the Schemes and have no impact on municipal accounts.
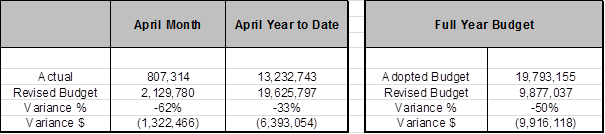
Profit/Loss on Asset Disposals (Actual $2.0m, Revised Budget $6.5m)
As at April month end the City has a total of $2.3m profit recorded in sales of assets. The income compiled predominantly from the sale of land proceeds distributed from the Tamala Park Regional Council, in addition to the sale of plant also contributing to the result. This profit has been partially offset by losses on asset sales totalling -$329k. The Net YTD variance totals -$4.5m (-69%).
Contributions of Physical Assets
Each year Developers assign physical assets such as parklands, roads and pathways to the City for its ongoing management and control. It should be noted that variations on the amounts of contributions of physical assets compared to budget has no direct impact to the City’s current financial year results, but can have a significant impact on future servicing, maintenance and renewal costs. The scale of the value of assets handed over to the City in the past has generally aligned closely to the percentage increase in the number of new Lots created during the financial year.
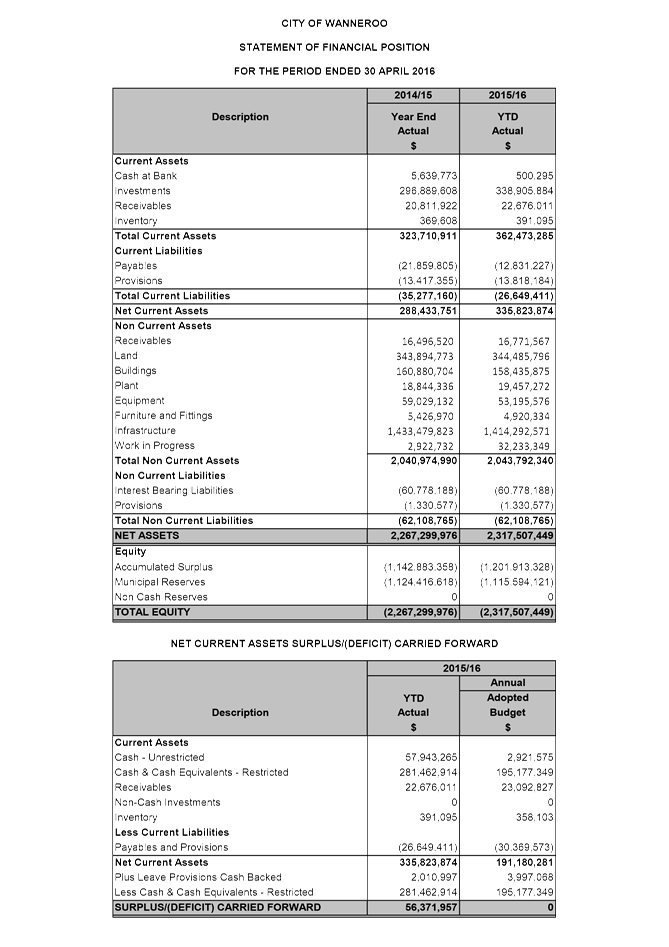
Statement of Financial Position (Refer to Attachment 2)
The Statement of Financial Position as at April month end presents a consistent level of operations. When compared to the position as at 30 June 2015 Net Assets have increased by $50.2m and reflects the timing of receipt of cash and a reduction in payables.
Non-Current Assets have marginally increased from 2014/15. Whilst the City undertakes Capital Works throughout the year the majority of this work is capitalised as part of the year end process. Similarly a revaluation exercise is undertaken each year for specific asset classes and consistent to Capital Works, these values are recognised at the end of the financial year.
Non-Current Liabilities remain unchanged from with 98% of this balance being directly related to the Western Australia Treasury Corporation loan.
RATIOS
The table below shows selected ratios for the month ending 30th April and are compared against 2014/15 end of year:
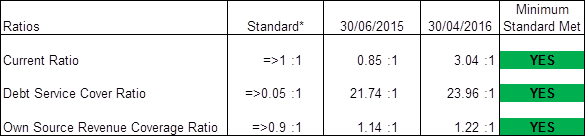
* Standard rates set by the Department of Local Government & Communities.
The Current Ratio provides information on the ability of the City to meet its short-term financial obligations out of unrestricted current assets. At 2014/15 year end, the City has a Current Ratio of 0.85:1 which was lower than the minimum of 1:1 recommended by the Department of Local Government and Communities (DLGC). This was due to various year end reserve transfers done on 30th June 2015. The Current Ratio at April month end was 3.04:1 which was above the minimum recommended by the DLGC.
The Debt Service Cover Ratio is the measurement of the City’s ability to produce enough cash to cover its debt payments. The City’s Debt Service Cover Ratio at April month end was 23:96:1 which was materially higher than the minimum of 0.05:1 recommended by the DLGC. The Debt Service Cover Ratio at 2014/15 year end was 21.74:1.
The Own Source Revenue Coverage Ratio is the measurement of the City’s ability to cover its costs through its own revenue efforts. The City’s Own Source Revenue Coverage Ratio at April month end was 1.22:1 which exceeds the minimum benchmark rate of 0.9:1 set by the DLGC. The Own Source Revenue Coverage Ratio at 2014/15 year end was 1.14:1.
Capital Works Program
The current status of the Capital Works Program as of 30 April 2016 is summarised below by Program Category.
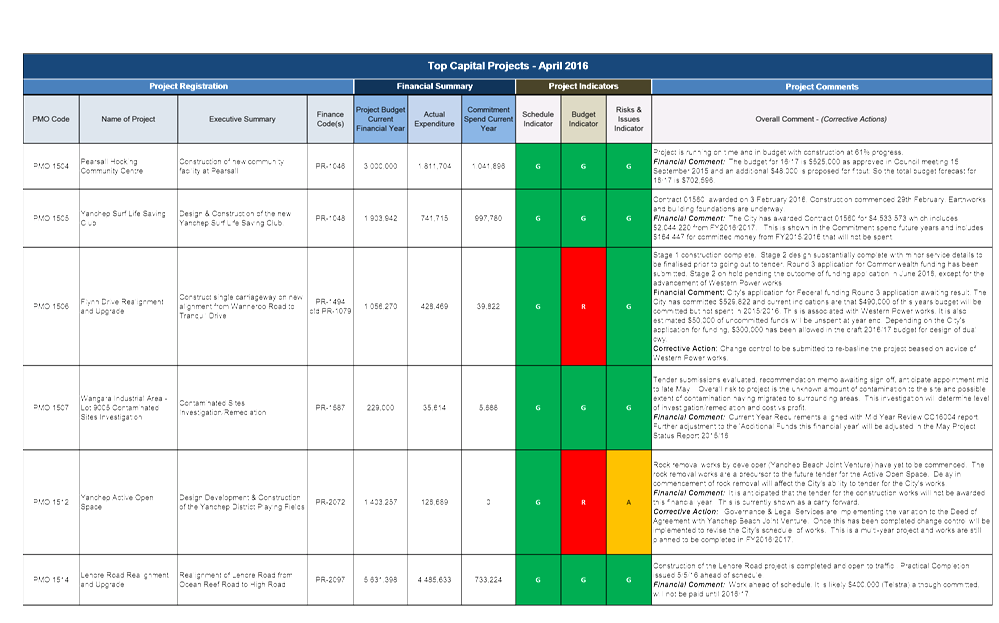
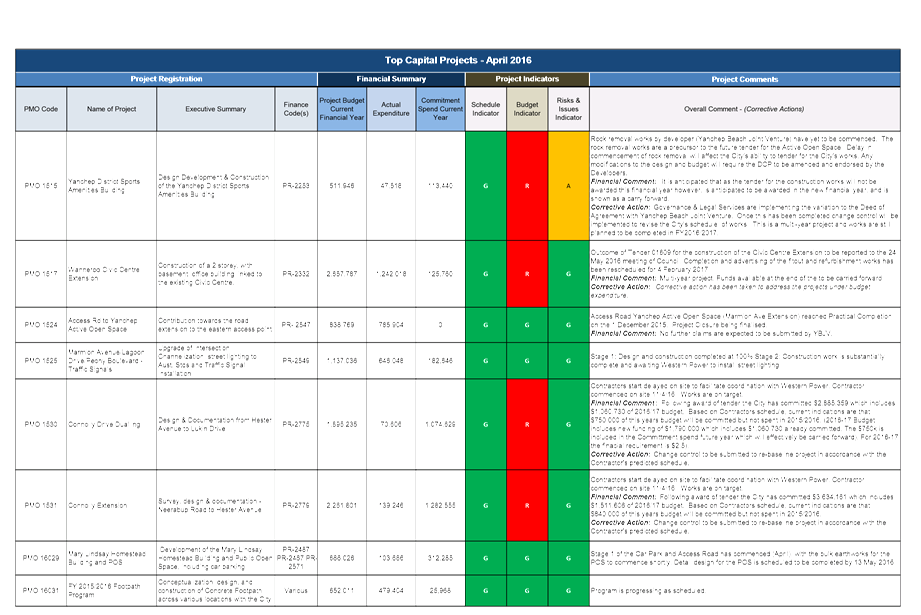
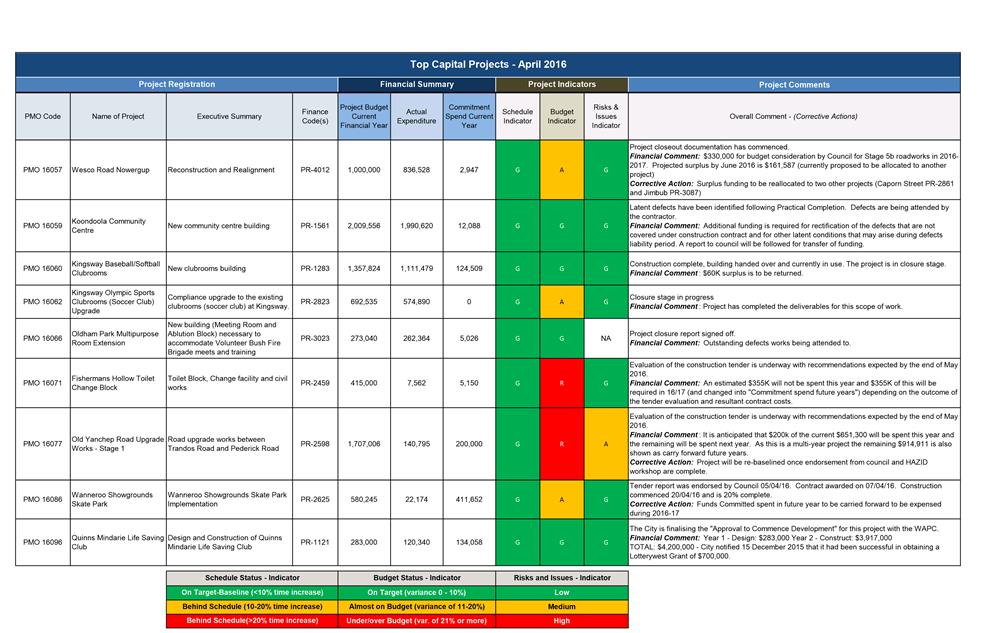
To further expand on the capital works program information above, key infrastructure projects are selected to be reported on, on a regular basis, which are itemised on the Top Capital Projects attachment to this report: (Refer to Attachment 5)
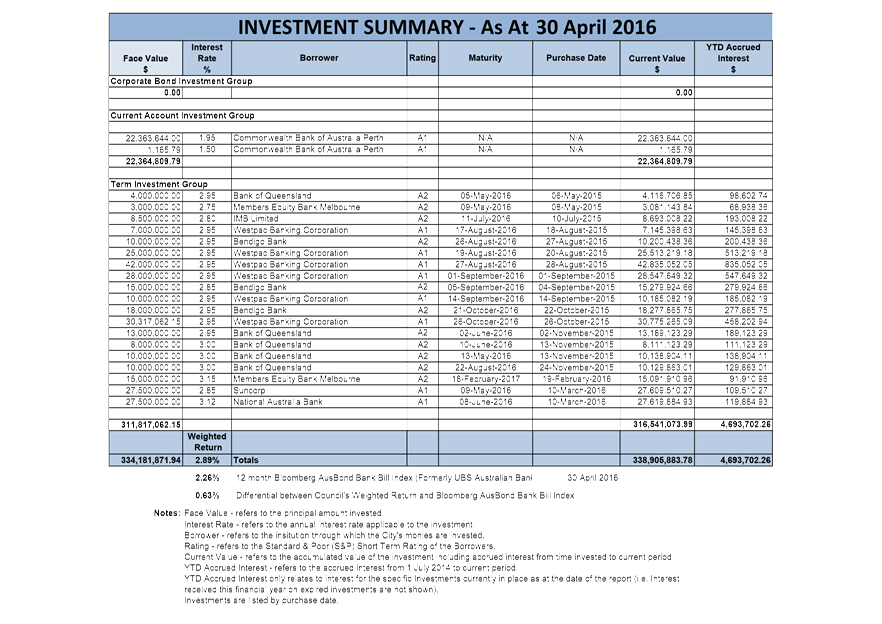
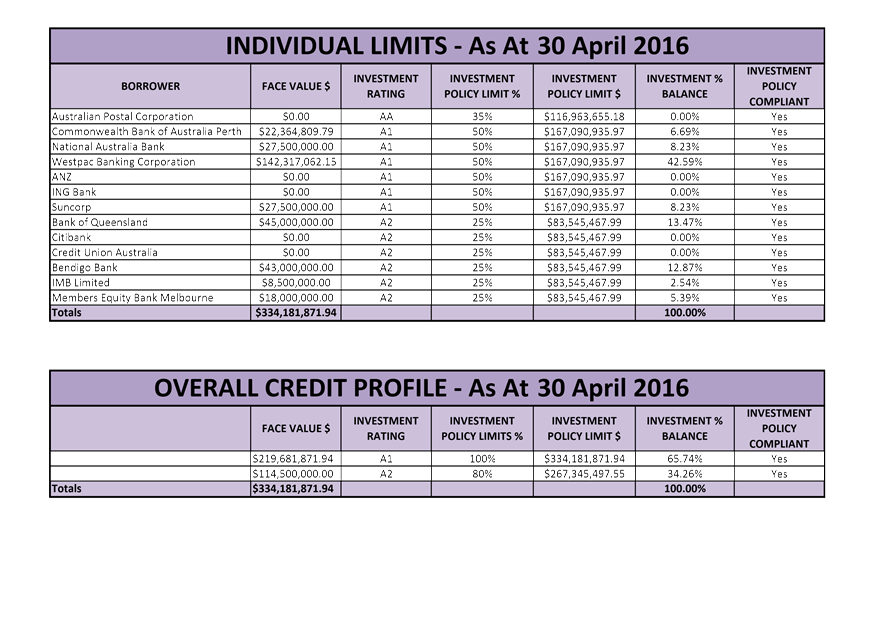
Investment Portfolio Summary (Refer to Attachment 3)
In accordance with the Local Government (Financial Management) Regulations 1996, the City only invests in the following highly secured investments effective from 1 August 2012:
1. Deposits with authorised deposit taking institutions and the Western Australian Treasury Corporation for a term not exceeding 12 months;
2. Bonds that are guaranteed by the Commonwealth Government or a State or Territory for a term not exceeding three years; and
3. Australian currency.
As at 30 April 2016, the City holds an investment portfolio (cash & cash equivalents) of $334.2m (Face Value). Interest Earnings were budgeted at a 2.91% yield. For the financial YTD ending April 2016 the City’s investment portfolio return has exceeded the Bank Bill index benchmark by 0.63% pa (2.89% pa vs. 2.26% pa).
Displayed below are graphical representations of the portfolio performance and earnings.
Note: Interest Earnings = Interest on investments plus Rates Instalment and Penalty Income.
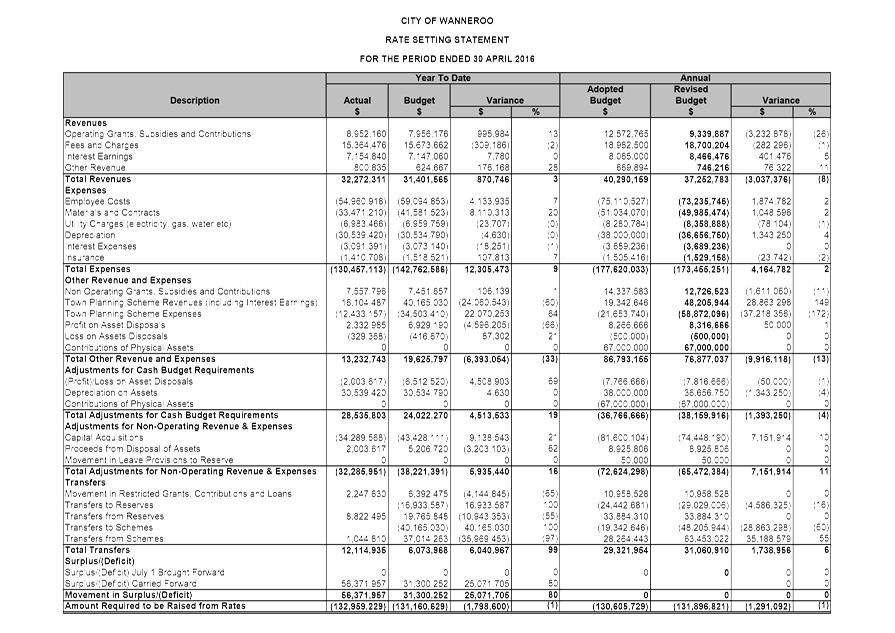
Rate Setting Statement (Refer to Attachment 4)
The Rate Setting Statement outlined in Attachment 4 represents a composite view of the finances of the City identifying the movement in the Surplus / (Deficit). This is based on the capital works and revenue & expenditure, and the resulting Rating Income required.
Statutory Compliance
This monthly financial report complies with Section 6.4 of the Local Government Act 1995 and Regulations 33A and 34 of the Local Government (Financial Management) Regulations 1996.
Strategic Implications
The proposal aligns with the following objective within the Strategic Community Plan 2013 – 2023:
“4 Civic Leadership - Working with others to ensure the best use of our resources.
4.3 A Strong and Progressive Organisation - You will recognise the hard work and professionalism delivered by your council through your interactions and how our community is developing.”
Risk Management Considerations
|
Risk Title |
Risk Rating |
|
Financial Management |
Moderate |
|
Accountability |
Action Planning Option |
|
Executive Management Team |
Manage |
The above risk relating to the issue contained within this report has been identified and considered within the City’s corporate risk register. Action plans have been developed to manage this risk to improve the existing management systems.
Policy Implications
Nil
Financial Implications
As outlined above and detailed in Attachments 1, 2, 3, 4 and 5.
Voting Requirements
Absolute Majority
That Council RECEIVES the Financial Activity Statements and commentaries on variances to YTD Budget for the period ended 30 April 2016, consisting of:
1. 2015/16 Annual Adopted and Revised Budget;
2. April 2016 YTD Revised Budget;
3. April 2016 YTD Income and Expenditure;
4. April 2016 Statement of Financial Position and Net Current Assets; and
5. April 2016 YTD Material Variance Notes.
Attachments:
|
1. |
April Income Statement |
16/152203 |
Minuted |
|
2. |
April Balance Sheet |
16/152211 |
Minuted |
|
3. |
Investment Report 15-16 |
16/152214 |
Minuted |
|
4. |
April RSS |
16/152216 |
Minuted |
|
5. |
Top Capital Projects - April 2016 |
15/511565[v10] |
|
CITY OF WANNEROO Late Items Agenda OF Elected Members' Briefing Session 14 June, 2016 22
File Ref: 20794 – 16/197450
Responsible Officer: Director Corporate Strategy and Performance
Disclosure of Interest: Nil
Attachments: 4
Issue
To consider the Financial Activity Statement for the period ended 31 May 2016.
Background
In accordance with Local Government Regulations, the Financial Activity Statement has been prepared in compliance with the following:
1. Regulation 34(1) of the Local Government (Financial Management) Regulations 1996, which requires a local government to prepare a statement of financial activity each month, presented according to nature and type, by program, or by business unit. For the 2015/16 financial year Council will present the statement of financial activity by nature and type.
2. Regulation 34(5) of the Local Government (Financial Management) Regulations 1996, which requires a local government to adopt a percentage or value, calculated in accordance with Australian Accounting Standards, to be used in statements of financial activity for reporting material variances. For the 2015/16 financial year Council will use 10% for the reporting of variances.
Detail
YEAR TO DATE RESULT FROM OPERATIONS
Overall Comment
The Result from Operations for the City to May month-end presents an overall favourable variance of +$15.0m (+267%) to YTD budget. Operating Revenue presented a favourable variance to YTD budget of +$2.6m (+2%). Expenditures from Operations also present a favourable variance of +$15.5m (+10%), with the main contributors being Materials & Contracts (+$8.4m) and Employee Costs (+$7.1m).
Consultation
Analysis of results has been undertaken in consultation with Directorate Managers.
Comment
The revised budget figures within this report are inclusive of the Mid-Year Review.
Below is a table which highlights the financial activity for the month of May 2016. Included in the table are the month’s revenues and expenditures by category, with corresponding budgets and variances.
In accordance with the requirement of Regulation 34(5) of the Local Government (Financial Management) Regulations 1996, the commentaries on 10% variances to budget in the Financial Activity Statement for the period ended 31 May 2016 are provided below.
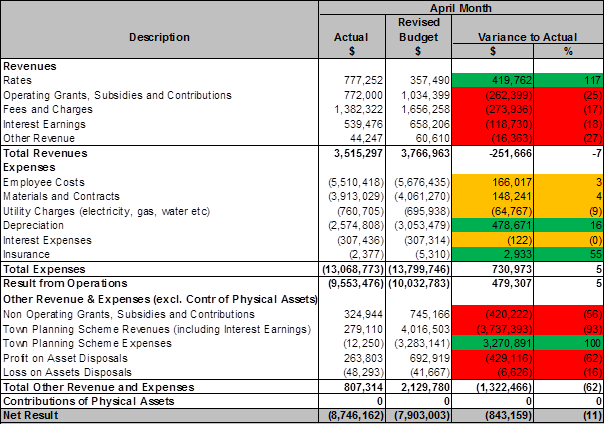
CURRENT MONTH
The below table highlights the operating performance for the City of Wanneroo for the month of May and identifies variances to budget for each category of income and expense. The following colours have been used to categorise levels of variance:
· Green >+10%
· Orange <+/-10%
· Red >-10%
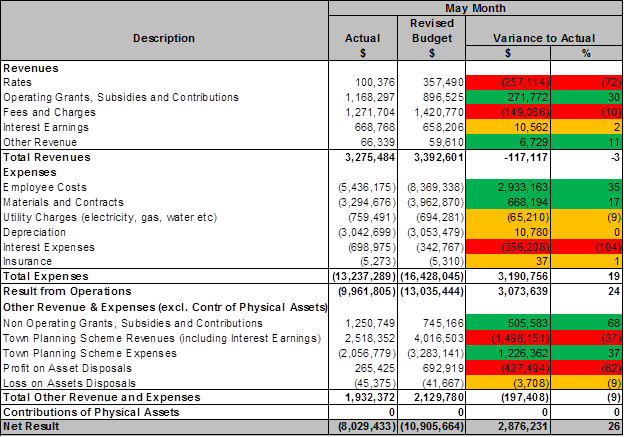
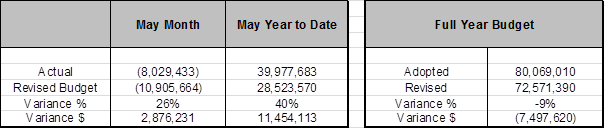
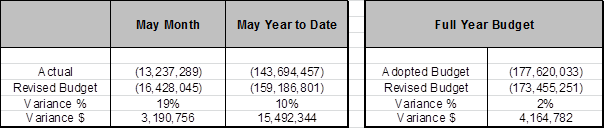
The month of May produced an overall favourable net result variance of 26% ($2.9m).
Operating Revenues showed a negative variance of -$117k (-3%). Rate income was below budget for the month of May predominantly through lower interim rates, this was however offset by favourable variances in the categories of Operating Grants, Subsidies and Contributions (through higher than budgeted State Grant receipts). Fees and Charges produced an unfavourable variance mainly through lower Permit Fee Income in May.
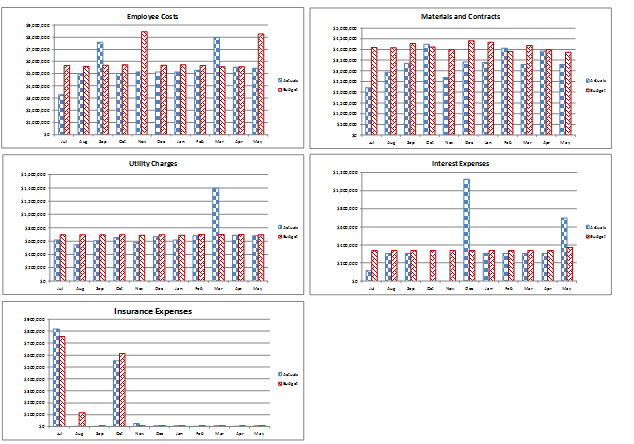
Operating Expenses displayed a positive variance of $3.2m (+19%). The more material contributors to this variance were Employee Costs (+$2.9 million) which is a timing difference on staff salary and wage expenses, Materials and Contracts (+$668k) mainly through bank fee charge reclassifications and contract expenses.
Other Revenue & Expenses produced an unfavourable variance of -$197K (-9%) which was mainly attributed to Town Planning Schemes and Asset Disposals. Town Planning Scheme revenues and expenses are accounted for when a cell has received income or the project expenses have been incurred. The timing of the income and expense is difficult to predict as work undertaken is not under the City’s direct control.
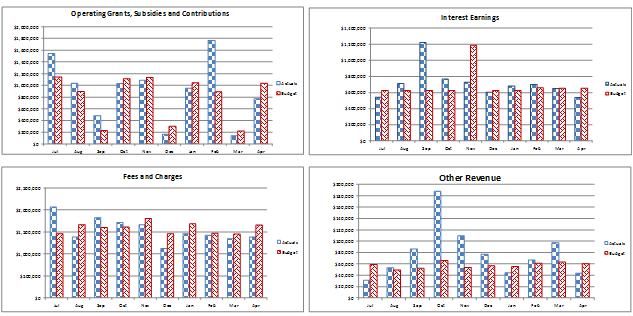
The graphs below illustrate the various operating income categories for each month and are compared against their respective monthly budgets. Rates have been excluded as almost the entire income amount for this category is received in one month. Rates income is presented in a graph further in this report titled “Operating Revenues – Cumulative YTD (Actual vs Budget)”.
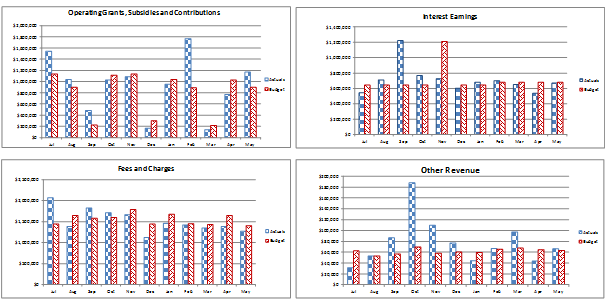
The following graphs represent the operating expenditure for each month and are compared against their respective monthly budgets. As a non-cash expense, depreciation has been excluded from these graphs but is shown as part of the graph titled “Operating Expenses – Cumulative YTD (Actual vs Budget)”.
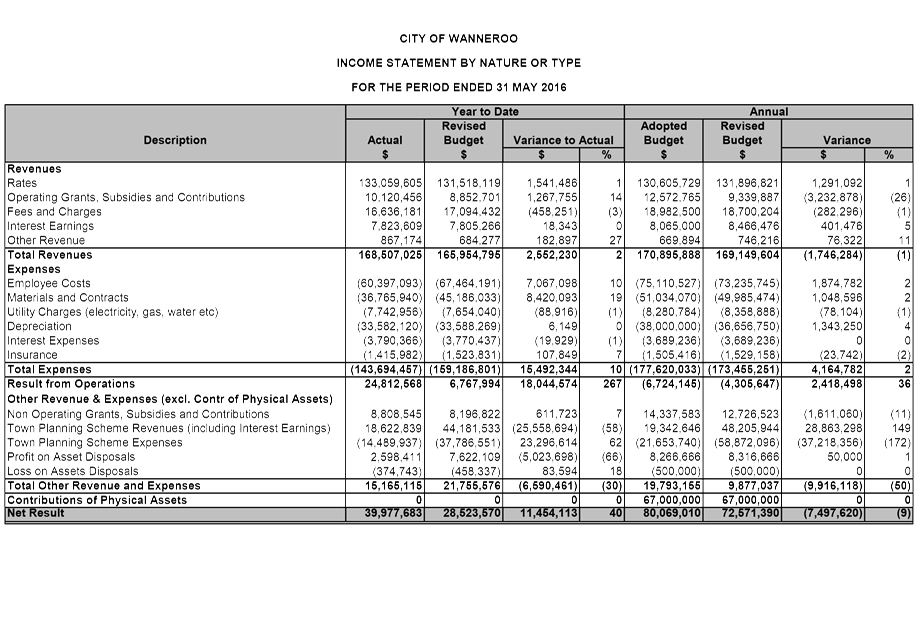
Income Statement (Refer to Attachment 1)
Year to Date Net Result
The year to date Net Result presented a favourable variance of +$11.5m (+40%). Details for the variances are outlined below.
Operating Revenues

The Year to April produced a positive variance of +$2.6m (+2%) comprising the following:
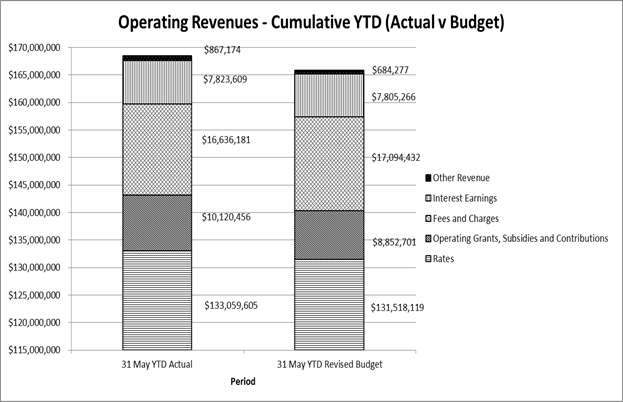
Operating Grants, Subsidies and Contributions (Actual $10.1m, Revised Budget $8.9m)
This income category shows a positive year to date variance of +14% (+$1.3m). The main contributor to the positive variance relates to the receipt of Mindarie Regional Council’s refund of carbon tax ($0.9m). A less substantial contributor to the variance is Main Roads grants relating to Parks Maintenance ($0.1m).
Other Revenue (Actual $0.9m, Revised Budget $0.7m)
This income category shows a positive year to date variance of +27% (+$183k). The main contributor to the positive variance relates to various receipts (+$149k) relating to Developer Contribution preparation costs for the Alkimos/Eglington development and Coastal Management Plan Assistance Program Funding from the Department of Planning. Another less substantial contributor was receipt of an insurance rebate of $48k.
Operating Expenses
Operating Expenses to May present a positive variance of +$15.5m (+10%). The above table highlights the month, YTD and full budget results which are further expanded in the section below. As with Operating Revenue, a bar graph is also included allowing comparison of expenditure categories.
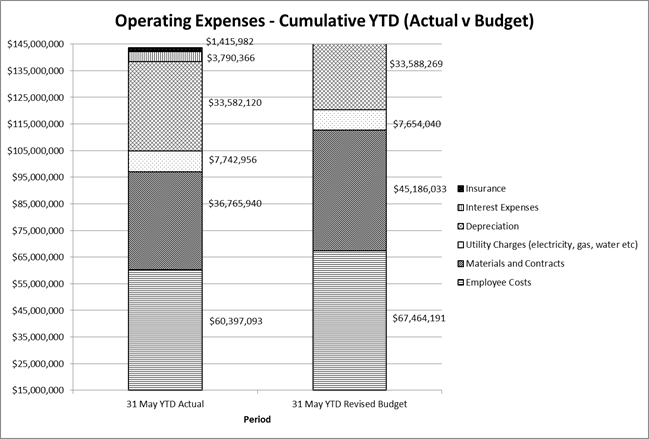
Employee Costs (Actual $60.4m, Revised Budget $67.5m)
This expense category presented a positive variance of 10% ($7.1m) to 31st May 2016. The main reason for the variance is the timing of salary and wage expenses ($5.2m). This variance will be offset in June when pay periods will fall in line with budget. Other less substantial contributors to the variance are lower superannuation and training course fee expenses ($1.5m).
Materials and Contracts (Actual $36.8m, Revised Budget $45.2m)
The Materials and Contracts Expense category reflects a YTD variance of +19% (+$8.4m). The main contributor for this relates to Contract Expenses which produced a positive variance of +$5.3m and reflects favourable variances in the Maintenance of Parks and Reserves and maintenance of Road Residential Land.
Refuse Removal Expenses also resulted in a positive variance to May (+$1.0m). This primarily relates to Domestic Rubbish Collection.
Material Expenses have produced a positive variance of +$0.6m. This category covers a number of expenses of which the higher contributors to the variance include materials for Domestic Waste Plant Maintenance and Public Facility Rubbish and Litter Collection which have a combined variance of $0.3m.
Consulting Fee Expenses showed a variance of +$0.8m reflecting under-spend in a number of service units. Consulting fees are budgeted on a monthly basis and are only incurred when required.
Fuel & Oil Expenses have also produced a positive variance to May (+$0.5m). This is largely contributed by the lower than anticipated fuel requirements within Waste Domestic Plant facilities and vehicles as well as lower fuel prices.
Other Revenue and Expenses
Town Planning Scheme (TPS) Revenues (Actual $18.6m, Revised Budget $44.2m)
This category of income showed an adverse variance to April of -58% (-$19.3m). This is attributed to Lot Sale contributions across various TPS Cells. The Cells with YTD unfavourable variances are Cell 9 (-$22.9m), Cell 6 (-$0.540m), Cell 1 (-$0.694m), Cell 4 (-$1.1m), Cell 8 (-$0.735m) and Cell 7 (-$0.460m). However, these were marginally offset by Cells with favourable YTD activity were Cell 5 (+$0.5m) and Cell 2 (+$148k). As with TPS Expenses these categories of income do not impact the City’s municipal operations.
TPS Expenses (Actual $14.5m, Revised Budget $37.8m)
TPS Expenses for the year to May total $14.5m which has produced a favourable variance of 62% (+$23.3m) YTD. These expenditures relate to specific costs and land purchases within the Schemes and have no impact on municipal accounts.
Profit/Loss on Asset Disposals (Actual $2.2m, Revised Budget $7.2m)
As at May month end the City has a total of $2.6m profit recorded in sales of assets. The income compiled predominantly from the sale of land proceeds distributed from the Tamala Park Regional Council, in addition to the sale of plant also contributing to the result. This profit has been partially offset by losses on asset sales totalling -$375k. The Net YTD variance totals -$4.9m (-69%).
Contributions of Physical Assets
Each year Developers assign physical assets such as parklands, roads and pathways to the City for its ongoing management and control. It should be noted that variations on the amounts of contributions of physical assets compared to budget has no direct impact to the City’s current financial year results, but can have a significant impact on future servicing, maintenance and renewal costs. The scale of the value of assets handed over to the City in the past has generally aligned closely to the percentage increase in the number of new Lots created during the financial year.
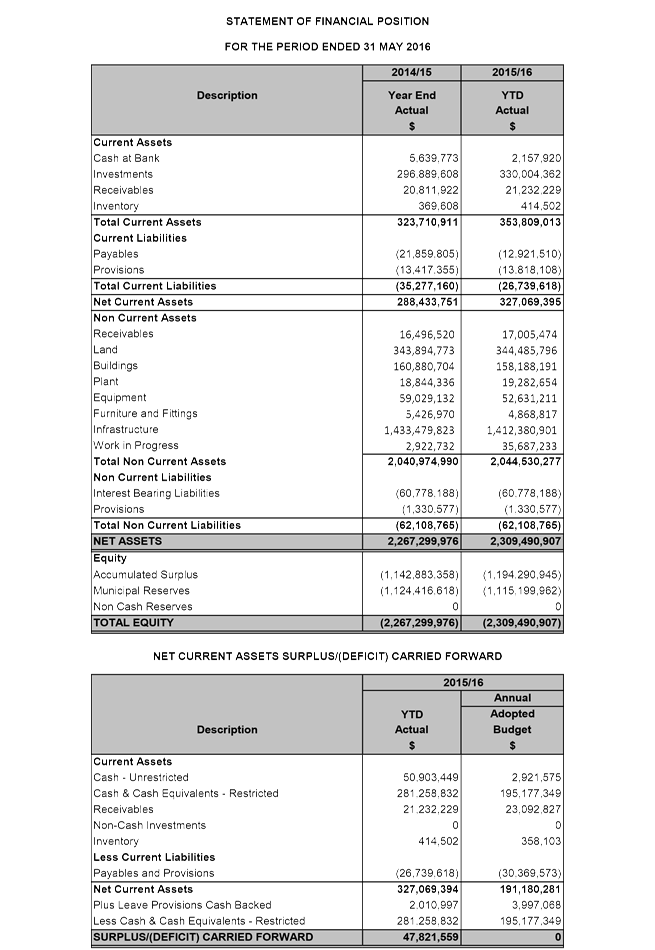
Statement of Financial Position (Refer to Attachment 2)
The Statement of Financial Position as at May month end presents a consistent level of operations. When compared to the position as at 30 June 2015 Net Assets have increased by $38.2m and reflects the timing of receipt of cash and a reduction in payables.
Non-Current Assets have marginally increased from 2014/15. Whilst the City undertakes Capital Works throughout the year the majority of this work is capitalised as part of the year end process. Similarly a revaluation exercise is undertaken each year for specific asset classes and consistent to Capital Works, these values are recognised at the end of the financial year.
Non-Current Liabilities remain unchanged from with 98% of this balance being directly related to the Western Australia Treasury Corporation loan.
RATIOS
The table below shows selected ratios for the month ending 31st May and are compared against 2014/15 end of year:
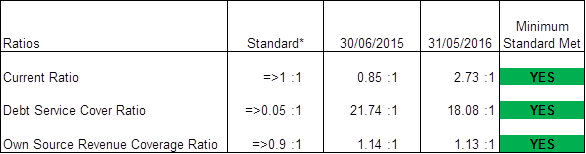
* Standard rates set by the Department of Local Government & Communities.
The Current Ratio provides information on the ability of the City to meet its short-term financial obligations out of unrestricted current assets. At 2014/15 year end, the City has a Current Ratio of 0.85:1 which was lower than the minimum of 1:1 recommended by the Department of Local Government and Communities (DLGC). This was due to various year end reserve transfers done on 30th June 2015. The Current Ratio at May month end was 2.73:1 which was above the minimum recommended by the DLGC.
The Debt Service Cover Ratio is the measurement of the City’s ability to produce enough cash to cover its debt payments. The City’s Debt Service Cover Ratio at May month end was 18.08:1 which was materially higher than the minimum of 0.05:1 recommended by the DLGC. The Debt Service Cover Ratio at 2014/15 year end was 21.74:1.
The Own Source Revenue Coverage Ratio is the measurement of the City’s ability to cover its costs through its own revenue efforts. The City’s Own Source Revenue Coverage Ratio at May month end was 1.13:1 which exceeds the minimum benchmark rate of 0.9:1 set by the DLGC. The Own Source Revenue Coverage Ratio at 2014/15 year end was 1.14:1.
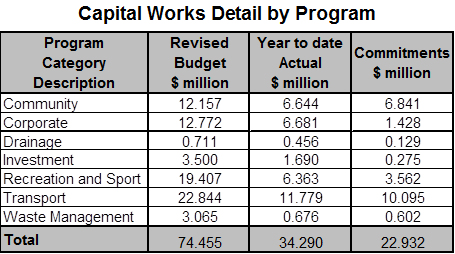
Capital Works Program
The current status of the Capital Works Program as of 31 May 2016 is summarised below by Program Category.

A review of the May 2016 financials for the Capital Works Program indicates that actual expenditure plus commitments equates to approximately 82% of the available budget. Some of the key projects which have progressed further include:
· Civic Centre Extension - tender awarded on 24 May 2016
· Yanchep District Playing Fields – Tender to be advertised on 4 June 2016
· Yanchep District Sports Amenities Building – Design progressing after the scope was agreed on 24 May 2016
· Pearsall Hocking Community Centre – Construction works progressing
· Lenore Road Reconstruction - Construction works progressing
· Connolly Drive Dual carriageway construction – Construction works progressing
· Irrigation Replacement Program – Works progressing
· Fisherman’s Hollow Toilet/ Change rooms – Tender evaluation in progress
· Wanneroo Skatepark - Construction works progressing
· Mary Lindsay Homestead and Public Open Space – Works progressing
· Warradale Park Nature Play – Tender awarded
· Sports Floodlighting Lake Joondalup Park – Design finalised and progressing to tender stage
· Paloma Park – Works progressing
· Marangaroo Golf Course Irrigation Renewal - Tender awarded on 24 May 2016
· Marangaroo Golf Course Fencing Replacement - Tender awarded on 24 May 2016
· Quinns Beach Coastal Renewal – Works completed in May 2016
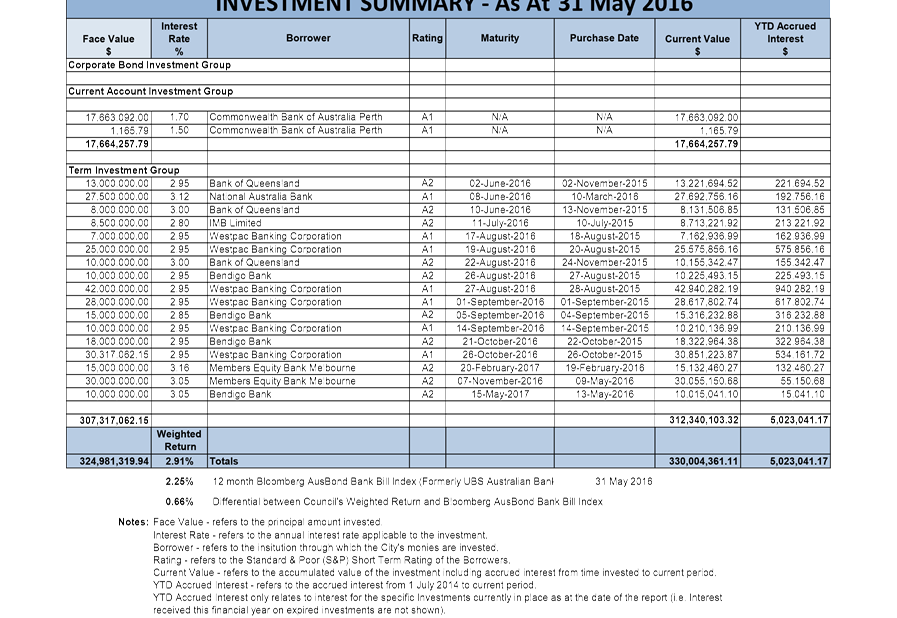
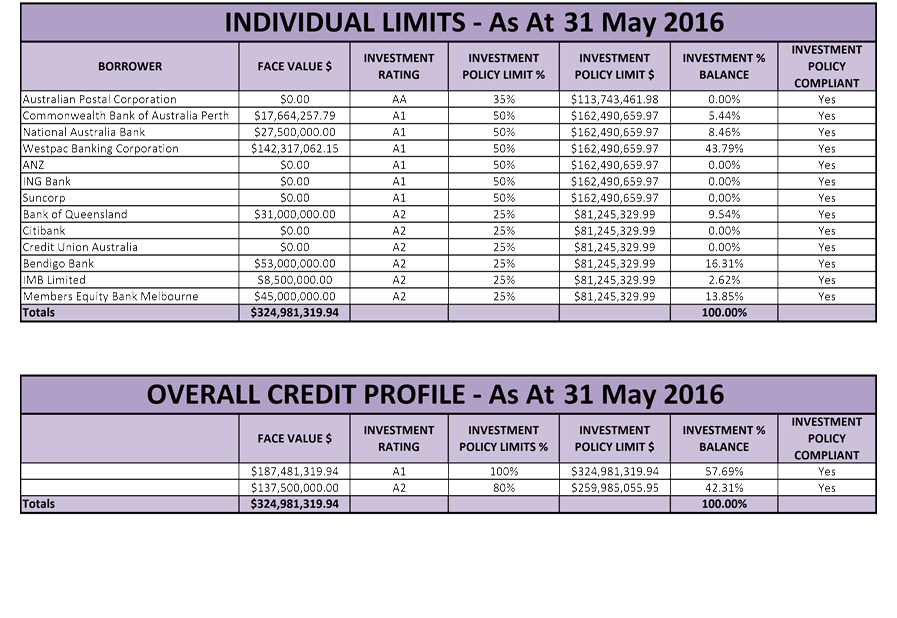
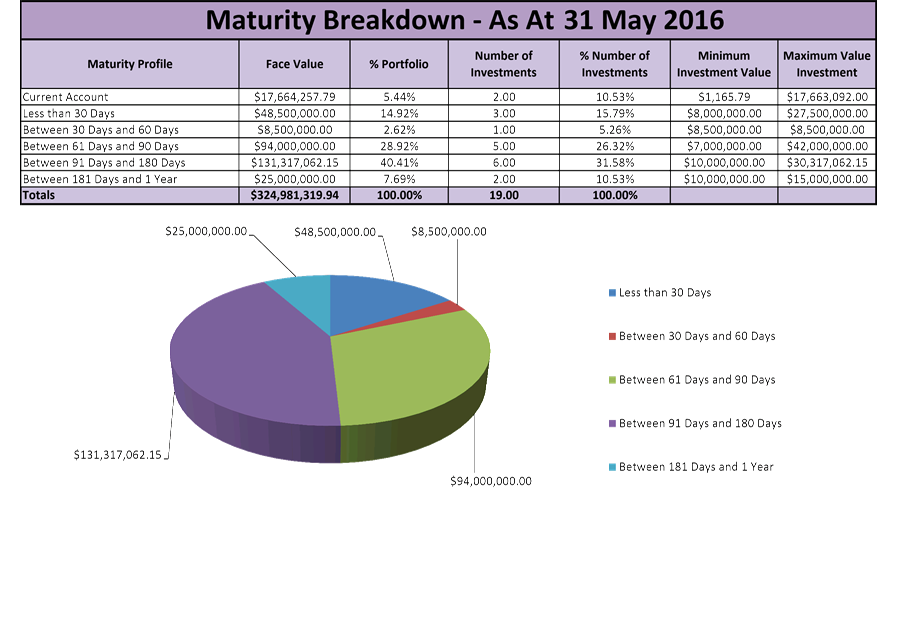
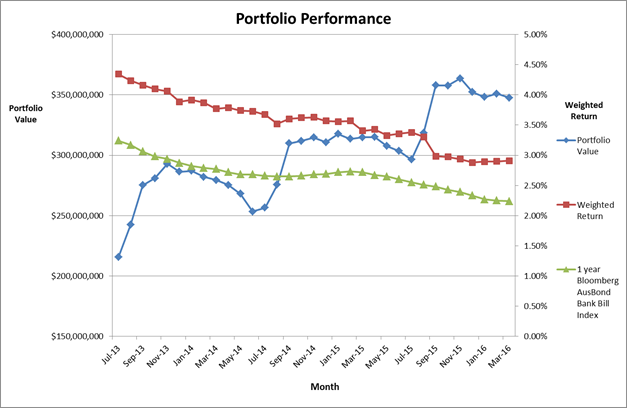
Investment Portfolio Summary (Refer to Attachment 3)
In accordance with the Local Government (Financial Management) Regulations 1996, the City only invests in the following highly secured investments effective from 1 August 2012:
1. Deposits with authorised deposit taking institutions and the Western Australian Treasury Corporation for a term not exceeding 12 months;
2. Bonds that are guaranteed by the Commonwealth Government or a State or Territory for a term not exceeding three years; and
3. Australian currency.
As at 31 May 2016, the City holds an investment portfolio (cash & cash equivalents) of $325.0m (Face Value). Interest Earnings were budgeted at a 2.91% yield. For the financial YTD ending May 2016 the City’s investment portfolio return has exceeded the Bank Bill index benchmark by 0.66% pa (2.91% pa vs. 2.25% pa).
Displayed below are graphical representations of the portfolio performance and earnings.
Note: Interest Earnings = Interest on investments plus Rates Instalment and Penalty Income.

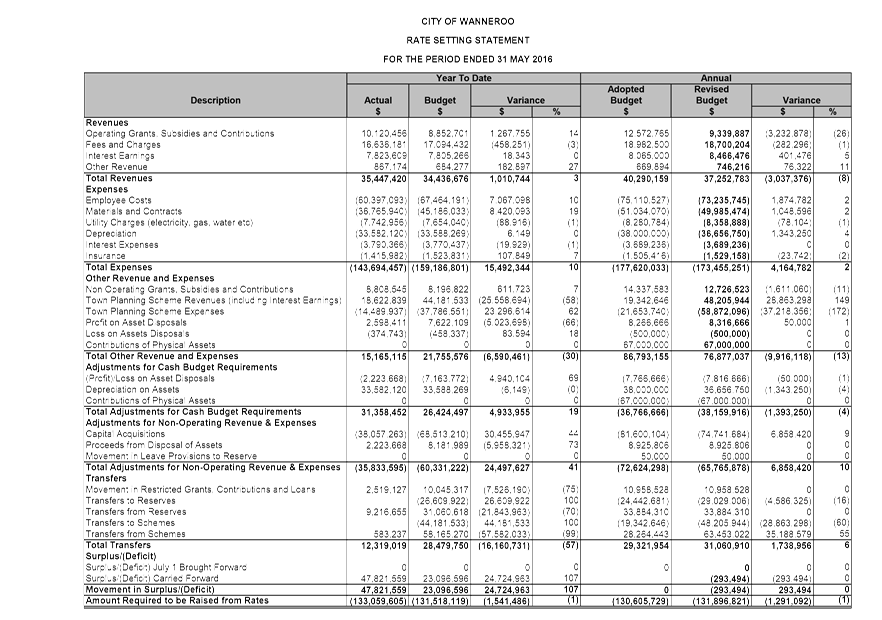
Rate Setting Statement (Refer to Attachment 4)
The Rate Setting Statement outlined in Attachment 4 represents a composite view of the finances of the City identifying the movement in the Surplus / (Deficit). This is based on the capital works and revenue & expenditure, and the resulting Rating Income required.
Statutory Compliance
This monthly financial report complies with Section 6.4 of the Local Government Act 1995 and Regulations 33A and 34 of the Local Government (Financial Management) Regulations 1996.
Strategic Implications
The proposal aligns with the following objective within the Strategic Community Plan 2013 – 2023:
“4 Civic Leadership - Working with others to ensure the best use of our resources.
4.3 A Strong and Progressive Organisation - You will recognise the hard work and professionalism delivered by your council through your interactions and how our community is developing.”
Risk Management Considerations
|
Risk Title |
Risk Rating |
|
Financial Management |
Moderate |
|
Accountability |
Action Planning Option |
|
Executive Management Team |
Manage |
The above risk relating to the issue contained within this report has been identified and considered within the City’s corporate risk register. Action plans have been developed to manage this risk to improve the existing management systems.
Policy Implications
Nil
Financial Implications
As outlined above and detailed in Attachments 1, 2, 3, 4 and 5.
Voting Requirements
Absolute Majority
That Council RECEIVES the Financial Activity Statements and commentaries on variances to YTD Budget for the period ended 31 May 2016, consisting of:
1. 2015/16 Annual Adopted and Revised Budget;
2. May 2016 YTD Revised Budget;
3. May 2016 YTD Income and Expenditure;
4. May 2016 Statement of Financial Position and Net Current Assets; and
5. May 2016 YTD Material Variance Notes.
Attachments:
|
1. |
May Income Statement |
16/201077 |
|
|
2. |
May Balance Sheet |
16/201081 |
|
|
3. |
May Inv |
16/201085 |
|
|
4. |
May RSS |
16/201086 |
|